The 4% rule has been much maligned lately, as recent market woes of the past 15 years – from the tech crash of 2000 to the global financial crisis of 2008 – have pressured both market returns and the portfolios of retirees.
Yet a deeper look reveals that if a 2008 or even a 2000 retiree had been following the 4% rule since retirement, their portfolios would be no worse off than any of the other "terrible" historical market scenarios that created the 4% rule from retirement years like 1929, 1937, and 1966. To some extent, the portfolio of the modern retiree is buoyed by the (only) modest inflation that has been occurring in recent years, yet even after adjusting for inflation, today’s retirees are not doing any materially worse than other historical bad-market scenarios where the 4% rule worked.
Ultimately, this doesn’t necessarily mean that the coming years won’t turn out to be even worse or that the 4% rule is “sacred”, but it does emphasize just how bad the historical market returns were that created it and just how conservative the 4% rule actually is, and that recent market events like the financial crisis are not an example of the failings of the 4% rule but how robustly it succeeds!
How Conservative Is A 4% Safe Withdrawal Rate?
The origin of the 4% was to look at what kinds of withdrawal strategies would have worked through various historical scenarios (the original study analyzed a 30-year time horizon, although the same approach can be applied for a shorter or longer time horizon as well), and pick the withdrawal rate that would have succeeded (for that time horizon) in the one worst scenario in history. By definition, if a retiree went through a future retirement scenario that was as bad as anything we’ve ever seen, the retirement would still succeed (just barely), and in any other scenario, the results would just be even better.
Of course, given that most of the time, a retiree doesn’t actually turn out to retire on the eve of the next great economic catastrophe, systematically implementing spending at a 4% initial withdrawal rate will most commonly just leave a huge amount of money left over. After all, while sometimes an unfavorable return sequence may occur, in general a 4% withdrawal rate is really quite modest relative to the long-term historical average return of almost 8% on a balanced (60/40) portfolio!
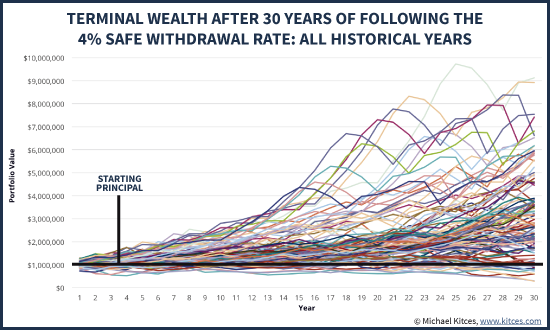
Accordingly, the chart above shows the nominal wealth path that would have occurred historically for a 60/40 portfolio with a starting balance of $1,000,000 that had a 4% initial withdrawal rate (adjusting spending each subsequent year based on inflation), going all the way back to the 1870s (using Shiller data). And as the results reveal, most of the time, the 4% rule just leaves a large amount of principal behind! Over 2/3rds of the time the retiree finishes the 30-year time horizon still having more-than-double their starting principal. The median wealth at the end – on top of the 4% rule with inflation-adjusted spending – is almost 2.8X starting principal. In other words, it's overwhelmingly more likely that retirees will have opportunities to ratchet their spending higher than a 4% rule, than ever need to spend that conservatively in the first place!
In fact, even when starting with a 4% initial withdrawal rate, less than 10% of the time does the retiree ever finish with less than the starting principal. And it has only happened four times in the ‘modern era’ of markets: for retirees who started a 30-year retirement time horizon in 1929, 1937, 1965, and 1966. In essence, then, these are the retirement years upon which the 4% rule is based; the whole reason we use the 4% rule is specifically to survive these kinds of ‘worst-case’ unfavorable-sequence-of-return scenarios we’ve seen historically.
How The 4% Rule Is Faring For 2000 And 2008 Retirees
The fact that the 4% rule is based on a particular subset of especially bad historical scenarios gives us a unique opportunity to compare recent challenging times for retirees – like those who retired in 2000 or 2008 – and see how they compare. In other words, if we looked at how the portfolio of a retiree was doing in the first half of a retirement starting in 1929, 1937, or 1966, would a retiree who started in 2000 or 2008 be doing similar, better, or worse?
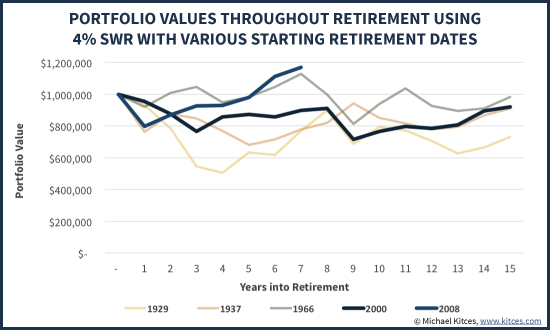
As the results reveal in the chart above, despite how shocking the tech crash and the 2008 financial crisis appeared to be in real time, the reality is that such retirees still have portfolios that are performing similar to or better than most of the historical 4% rule scenarios. The 2000 retiree is already half way through the 30-year time horizon with similar wealth to a 1929, 1937, or 1966 retiree had at this point, and the 2008 retiree is even further ahead than any of those historical scenarios (and even ahead of the 2000 retiree, too!).
Of course, an important caveat to the chart above is that it’s based on ‘nominal’ dollars, not adjusted for inflation. Which is important, because it means that retirees who had similar portfolio balances after the first half of retirement were not necessarily going to have the same buying power with those dollars for the rest of retirement (because of what inflation had been in the first half of retirement). This is especially true for the 1966 retiree, who experienced significant double-digit inflation in the first half of retirement.
Accordingly, the chart below re-calculates the progress of these retirees, based not on the nominal value of their portfolio through the first half of retirement, but based on the amount of inflation-adjusted spending they were doing from the portfolio at that halfway point. In other words, what was the retiree’s then-current withdrawal rate, year by year, as both the portfolio bounced around and inflation-adjusted spending requirements continued to rise each year.
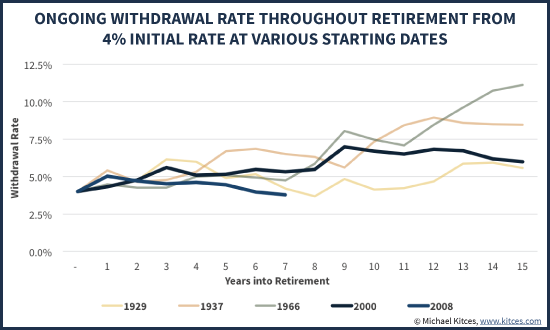
In this chart (where lower numbers are good, because it means the withdrawal rate is low and spending is modest relative to wealth), it quickly becomes clear after adjusting for the level of inflation-adjusted spending how much more severely adverse the first half of retirement was for the 1966 retiree than the others (the 1966 line is much higher than the rest). Even though the value of the portfolio was similar to the other retirements when measured half way through retirement, the current withdrawal rate at that point was far more problematic, having already spiked above 10% with 15 years still to go. In fact, the only reason the 1966 retiree was able to finish retirement at all with such a high withdrawal rate at the midpoint is that, by the half-way mark of retirement in 1981, both the stock and bond markets had gotten so cheap (yields had gotten so high) that the superior returns (and declining inflation) made it possible to finish successfully.
Relative to the 2000 or 2008 retiree, though, the results continue to look reasonably in line. Certainly the markets are not as favorably valued now for the 2000 retiree as they were in 1981 for the 1966 retiree, but then again the 2000 retiree is still only at a 6.2% withdrawal rate today (with just 15 years to go), while the 1966 retiree was over a 10% withdrawal rate at this point. And in the case of a 2008 retiree, the withdrawal rate is already right back at the 4% initial withdrawal rate the retiree began with (after already doing 6 years' worth of retirement spending!).
Keeping Retiree Market Disasters In Historical Context
Ultimately, the key point here is simply to recognize that the 2000 retiree is merely ‘in line’ with the 1929 retiree, and doing better than the rest. And the 2008 retiree – even having started with the global financial crisis out of the gate – is already doing far better than any of these historical scenarios! In other words, while the tech crash and especially the global financial crisis were scary, they still haven’t been the kind of scenarios that spell outright doom for the 4% rule.
The viability of a 2008 retiree following the 4% rule is especially notable, and reflects a key (but often ignored or misunderstood) tenet of managing sequence-of-return risk in retirement: it’s actually not just about having a severe market crash in the early years of retirement, but a crash that doesn’t recover quickly. Or more generally, the reality of sequence-of-return risk is that it’s more about having a mediocre decade’s worth of returns, not just a sharp single-year decline that goes through a similarly sharp recovery. And since the markets in the aftermath of 2008 have not stayed down and in fact have been more like a V-shaped recovery (as the S&P 500 has rocketed upwards to now be more than triple its value from the March 2009 trough), it turns out the 2008 financial crisis was an example of something that is not a dangerous sequence-of-returns event after all!
Of course, it’s also notable that while the 2000 and 2008 retirees are equal to or ahead of their respective historical-worst-case counterparts, the currently high valuation of the markets (based on Shiller P/E ratios) along with today’s low bond yields mean that those portfolios may be more stressed going forward from here. Still, though, these 2000 and 2008 scenarios are facing greater headwinds from what is otherwise still a lower withdrawal base than most of the other comparable bad-sequence historical scenarios. In other words, even if market returns are worse going forward from here than the bad market scenarios that safe withdrawal rates are based upon, the portfolios of today’s 2000 and 2008 retirees may still be more than far enough ahead to survive the 30-year time horizon anyway. It simply means they’ll be additional examples of scenarios that didn’t leave much at the end of a 30-year retirement, but not necessarily ones that breach the 4% rule in the first place.
Arguably, the case of the 2000 retiree is perhaps somewhat concerning, given a 6.2% current withdrawal rate for what is still a 15-year retirement time horizon (as a 65-year-old couple in 2000 would be turning 80 this year) built on a base of currently high market valuations and currently low yields. It wouldn’t be surprising to me to see the year-2000 retiree end out pushing the limits of the 4% rule, given that market valuations were stratospheric at the time, even relative to historical standards. Still, the current 6.2% withdrawal rate of that year-2000 retiree today is actually modest enough that a retiree couple in such a scenario could simply take the remainder of their portfolio, and buy a joint and survivor single premium immediate annuity with inflation-adjusting payments. At current market rates, the inflation-adjusting payout for the 80-year-old couple (assuming the 65-year-old retirees are now 15 years into retirement) would be 6.5% for their joint lives, more than enough to cover their 6.2% spending rate. Which means even the 2000 retiree isn’t yet below the ‘critical threshold’ that couldn’t simply be guaranteed for life, if depletion was a concern. In addition, a growing base of research suggests that retiree spending in real dollars tends to decline in later years – i.e., spending increases for retirees in their 70s and 80s don’t even keep pace with inflation – which means in practice a 2000 retiree today is probably even better off and spending even less as a current withdrawal rate than these calculations would suggest.
The bottom line, though, is simply to recognize that even market scenarios like the tech crash in 2000 or the financial crisis of 2008 are not ones that will likely breach the 4% safe withdrawal rate, but merely examples of bad market declines for which the 4% rule was created. In turn, this is an implicit acknowledgement of just how conservative the 4% rule actually is, and how horrible the historical market returns really were that created it. In the end, this doesn’t necessarily mean that the 4% rule is ‘sacred’ and that some future market disaster couldn’t be bad enough to undermine it (and of course, it can/should still be adopted for individual circumstances like a longer/shorter time horizon, the impact of taxes, the impact of fees and other investment costs, etc.). But when the Great Depression and the stagflationary 1970s couldn’t break it, and the crash of 1987 and even the global financial crisis of 2008 were just speed bumps, it will take a lot to set a new safe withdrawal rate below 4%!

No comments:
Post a Comment