Thursday, July 31, 2014

The Case for Careful Analysis of Nontraditional Bond Funds

As the end of the 30 year bond bull market begrudgingly gives over to the consensus-expected rate rise, investors’ persistent worries about the impacts of falling bond prices on their portfolios have provided great opportunity for asset managers to aggressively market and/or launch “nontraditional bond” funds. Unlike core or intermediate term bond funds, which typically benchmark their asset classes, duration and performance to the Barclays U.S. Aggregate Bond Index, nontraditional bond funds generally seek to limit interest rate exposure in an effort to preserve capital in the event of higher yields and tightening monetary policy.

Likely helped by 2013’s “Taper Talk” rate rise, the industry’s marketing of these funds and rotating client assets from core bond funds has been very successful. The Morningstar Nontraditional bond category has nearly quadrupled in total number of funds over the past five years from 25 unique funds to 84 as of the start of June. This growth is even more evident when looking at assets. The universe has seen heavy and rapid inflows, more than doubling total AUM in the past 18 months from $68 billion at the end of 2012 to current aggregate AUM in excess of $145 billion. Indeed, Morningstar has deemed nontraditional bond funds’ growth rate “blistering”; over the past year, the group has gathered more assets than any Morningstar category besides Foreign Large Blend (International Equity). Comparatively, the Intermediate Term Bond category has seen a decline in the number of funds and assets, with 17% fewer funds at the end of May as there were five years ago and a 10% decrease in total category assets over the past year due to outflows.
Often used interchangeably with the label “unconstrained” bond funds (as well as “alternative” and/or “long/short”), the general principle (and hook) is that nontraditional bond managers have the flexibility to 1) invest in nearly any fixed income market, 2) make tactical allocations independent of benchmarking and 3) maintain the ability to take both long and short positions. In particular, these managers generally have more flexibility on duration management – including the aforementioned freedom to be short rates – an attractive quality as investors brace themselves for inevitable rate increases.
Despite their popularity, some feel that these funds are simply trading rate risk for credit risk in the form of high yield and emerging markets debt. With tighter correlations between low quality credit and equities, such credit risk doesn’t quite match the conservative stance many investors seek in their fixed income allocations. Debate of the role of such investments in a portfolio setting aside, both retail and institutional investors are increasingly opting to gain alternative exposure through a 40 Act structure, making the numerous (and varied) new nontraditional bond offerings an object of intense attention.
Against this backdrop, we used a quantitative lens to examine some of the characteristics of funds in the Nontraditional Bond category, looking to 1) better understand the level of homogeneity or heterogeneity in behavior and strategy, 2) evaluate some of the common risks exhibited by the category and 3) verify the perception that such funds provide lower duration risk, potentially, at the cost of higher credit risk.
There are 58 distinct, active funds in the Nontraditional Bond category with at least 1 years’ worth of data as of the end of May 2014.[1]  We used MPI’s proprietary Dynamic Style Analysis (DSA) and weekly net asset values to identify the set of factor exposures that best replicate each funds’ performance over the past year. Please note that these “factor exposures” are the result of a purely quantitative analysis and are not based on actual holdings.[2]  The results can be seen in the chart below:
PeerAvg_sml
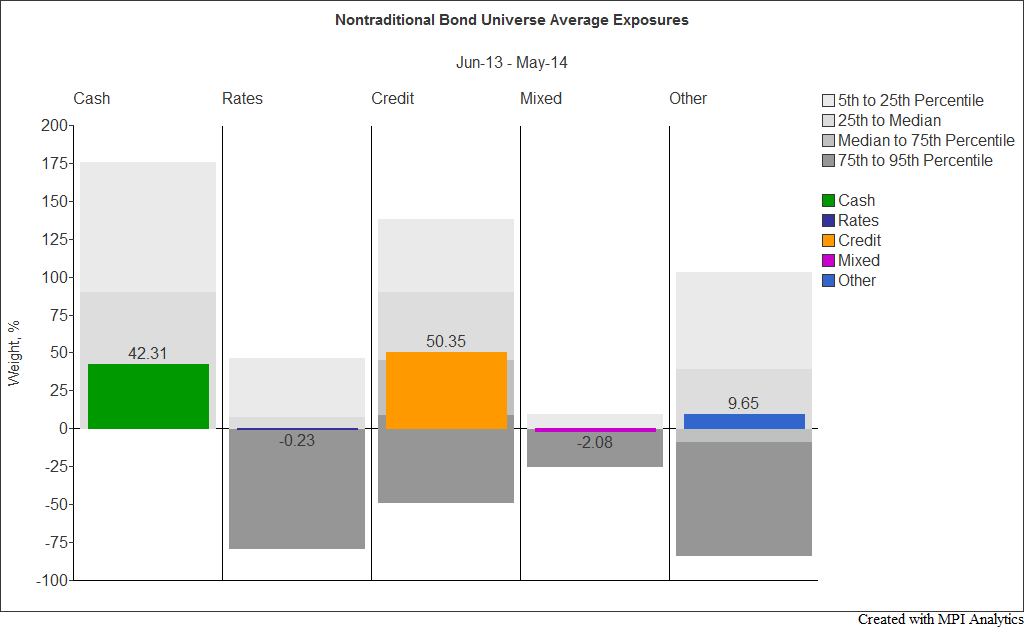
For simplicity in reporting, each vertical section of the graph above represents a macro basket of underlying sub-factors.  For example, the “Rates” basket includes US government bonds, the “Credit” basket high yield bonds, “Mixed” includes investment grade corporates, while the “Other” category includes those assets which are comparatively insensitive to the other baskets[3], including short term bonds and issues from other developed countries.  Please note that “Cash” may not always be interpreted literally; it may also represent either reduced volatility (in the case of estimated long positions) or excess volatility (in the case of estimated short positions) or else some other form of leverage.
At first glance, it seems that the general perception is correct – the nontraditional bond universe, on average, 1) exhibits very little exposure to the most rate-sensitive factors, 2) appears to have its highest exposure to credit sensitive factors and 3) displays long exposure to less rate-sensitive alternatives in the “Other” basket.
Looking past the average, however, the range of results indicated by the dispersion in the universe is extraordinarily large. Half the funds appear to have positive exposure to rate-sensitive assets, while the bottom quartile shows estimates ranging from 0% to a short position of around -80%.  Similarly, long credit exposure (high yield) ranges from 0% to over 135% for three quarters of the funds, yet a significant minority have short exposure estimates.This is clearly not a homogenous group, investing in a similar fashion.
The advantage that the fund managers may have in the ability to invest anywhere to execute their investment thesis and view on rate risk appears to be a distinct challenge for fund buyers in analyzing the funds.
Using MPI’s proprietary measure of predictability, Predicted R-Squared[4], we find the median value for the group is 72%. From a quantitative modeling standpoint, this is a level more akin to a group of absolute return hedge funds than bond mutual funds. This should give investors and analysts pause. The observed value indicates that while a good proportion of the average funds’ returns can be reliably explained by the factors used, there are likely a number of missing or extraneous factors when analyzed on a fund-by-fund basis.  This is not surprising as we used a set of generic factors as explanatory variables where the actual exposures could be quite specific and broad given the funds’ unconstrained approach. It is, however, an additional indicator of the disparity in investment approaches within the group.
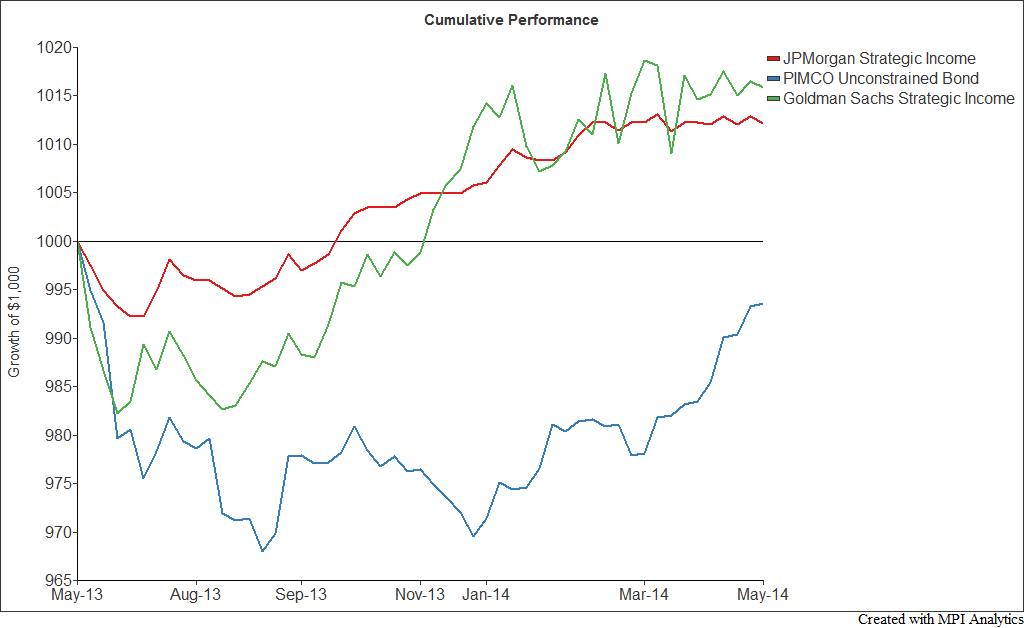
Looking at some representative funds, the impression of heterogeneity is reinforced.  The three largest funds in the category by AUM are Goldman Sachs Strategic Income A (GSZAX, +$24 billion)JP Morgan Strategic Income A (JSOSX, +$26 billion) and PIMCO Unconstrained Bond Inst (PFIUX, +$22 billion).  The funds’ cumulative returns for the past year are shown below.  The path of their returns indicates significantly different investment approaches.  The average weekly correlation between the three funds over the past year is 42%.  By comparison, the average correlation between the largest three Intermediate-term bond funds (by AUM) is 93%. – the top three include industry-leading active managers Jeffrey Gundlach’s DBLTX and Bill Gross’ PTTRX, as well as the Barclays Capital U.S. Aggregate Bond Index tracking Vanguard Total Bond Market Index Inv (VBMFX).
Growth_sml
Looking at the three funds’ average exposure estimates, we can see just how dissimilar they appear in a purely quantitative replication of their performance.  Please note that the generic factors used on these funds are the same as those used on the universe above and are unlikely to be the optimal mix for any one fund indvidually.  Regardless, as with the fund universe , the disparity in results strongly indicates that these funds are not comparable on any but a nominal basis and require greater care on the part of investors when selecting and monitoring.
IndivAvg_sml
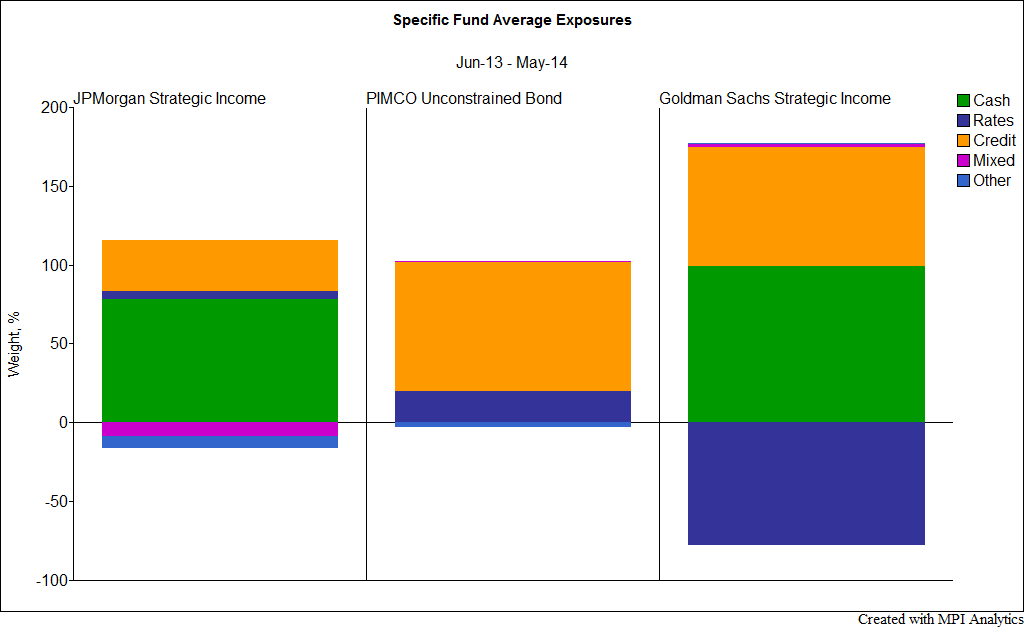
All three indicate long credit exposure, but in quite different proportions. It is also important to understand the perceived net exposures of the funds. GSZAX appears to have exposure to that which concerns most category critics – short rate-sensitive assets and long credit sensitive, with little net market exposure. JSOSX’s net market exposure is estimated at only about 20%, while PFIUX[5] appears to have full market exposure.
What could these differences mean to investors from a risk perspective? Seeking to answer this question, we tested the current (as of May 30, 2014) exposures for each of the funds and evaluated the replicating (dynamic beta) portfolios’ performance in terms of max drawdown return during two recent periods of stress, the Credit Crisis (June 2007- Dec. 2008) and the Taper Tantrum (May-Sept. 2013).  For reference, two passive indices are included as benchmarks; the BofA ML High Yield Master II Index, and the BofA ML Treasuries index with maturities of 10+ years.
Scenario_sml
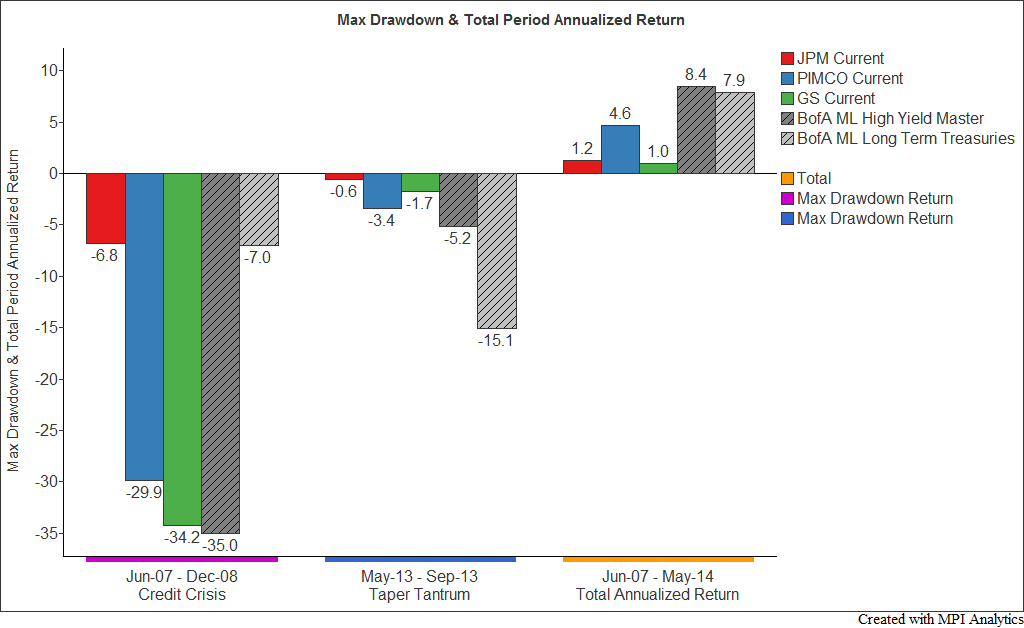
Our analysis of all three funds indicates reduced sensitivity to rate changes in 2013, although to different extents.  The JP Morgan Funds shows effectively none, while the PIMCO fund retains at least some rate exposure. In terms of credit risk, again the JP Morgan fund appears to have very little – while the PIMCO fund and Goldman Sachs funds seem to take on a considerable amount. This is just an exercise, of course, and given the funds’ (varying) tactical mandates an investor shouldn’t expect the portfolio to remain stagnant in times of stress.[6]With 2014’s surprise broad bond rally YTD, particularly to long duration government bonds, it is worth noting the varying impacts on current portfolios of an intense “flight-to-quality” period, exemplified here by the Credit Crisis.
Nontraditional bond and unconstrained bond are fuzzy labels, encompassing a considerable range of investment strategies, mandates and risk exposures. This blurring of lines over a fresh-faced, fast-growing group of heterogeneous (and let’s not forget expensive) offerings renders analysts and advisors unable to rely on either category or label to know how to fairly evaluate funds in this ballooning area. Rather, individual manager analysis and the use of smaller, highly targeted peer groups (when possible) should be key in choosing a fund, and determining its role in a portfolio. This is animportant moment for asset managers too. With assets flowing to these offerings,providers must realize the importance in educating investors on the nature of these (typically) new products and their role within a portfolio orientation, as well as the opportunity to differentiate their offering(s) from an increasingly crowded pack.

[1] Implying over 30% of funds in the category have track records less than 12 months at the time of the analysis.
[2] DISCLAIMER: MPI conducts performance-based analyses and, beyond any public information, does not claim to know or insinuate what the actual strategy, positions or holdings of the funds discussed are, nor are we commenting on the quality or merits of the strategies. This analysis is purely returns-based and does not reflect insights into actual holdings. Deviations between our analysis and the actual holdings and/or management decisions made by funds are expected and inherent in any quantitative analysis. MPI makes no warranties or guarantees as to the accuracy of this statistical analysis, nor does it take any responsibility for investment decisions made by any parties based on this analysis.
[3] Which is not to say they don’t have their own risks.
[4] Beyond simple fit as indicated by R2, Predicted R2 is a cross-validation measure of the predictive value of the analysis.
[5] Bill Gross took over the management of the fund in December 2013 from Chris Dialynas and made substantial changes to the portfolio.  Therefore the average exposures are unlikely to be representative of the current. For more, see: http://www.bloomberg.com/news/2014-03-05/pimco-overhauls-unconstrained-fund-as-gross-takes-control.html
[6] All three funds were operational for the Taper Tantrum period and JSOSX and PFIUX were live for a portion of the Credit Crisis period tested, launching in Q4 and Q3 of 2008, respectively. (both funds’ performance through the heavy down market indicates low net credit exposure)

Sunday, July 27, 2014

THE FED PRISONER’S DILEMMA: SELL NOW OR KEEP DANCING?


“When the music stops, in terms of liquidity, things will be complicated. But as long as the music is playing, you’ve got to get up and dance. We’re still dancing.” – Chuck Prince, July 10, 2007
[Joe Kernen: You have been on Squawk Box and said as long as -- you sound like Chuck Prince. You're still dancing now basically. Until they raise rates you're going to dance, right?
Stan Druckenmiller: First of all, I'm not like Chuck Prince because I can get out. I am still dancing, but Chuck Prince and the Fed, if they're wrong, cannot get out. I can get out in a week.] – CNBC, July 17, 2014
Some of you may be familiar with game theory and the famous example of the Prisoner’s Dilemma. In the game, two members of a criminal gang are arrested, imprisoned, and isolated. They have two options: 1) cooperate with one another (stay silent), or 2) betray one another (testify that the other committed the crime). The various payoffs for each decision can be seen below.
PD1
The dilemma is as follows. From a purely self-interest perspective, it is in each prisoner’s best interest to defect as they have the opportunity to go free with the other party serving 3 years if other party stays silent. However, as both prisoners are likely to pursue this self-interested option, they are collectively worse off, with each prisoner receiving 2 years in jail. Had they cooperated and remained silent, they would have each served only 1 year in jail, the best possible combined outcome.
The Fed Prisoner’s Dilemma
Many market participants today are faced with a similar dilemma, and they have become prisoners, in recent months, to Federal Reserve policy. After five and a half years of 0% interest rates and three rounds of QE, returns on virtually all asset classes have been pulled forward. This is precisely what the Fed intended to happen as Ben Bernanke made clear in his famous “wealth effect” Op-ed in 2010.
It is debatable whether there has indeed been a “virtuous circle” as Bernanke suggested, where higher stock prices were supposed to “spur spending” and “lead to higher incomes and profits.”
What is not debatable is that bond yields are at/near all-time lows while stock prices are near valuation highs. This suggests that forward returns from here are likely to be significantly below average. As such, market participants are becoming increasingly reliant on the Federal Reserve to maintain the status quo, and to not pullback from unprecedented measures even five years into a recovery. For if asset prices are elevated in large part because interest rates are artificially low, it stands to reason that if interest rates are no longer held down asset prices will have to fall.
The dilemma today is as follows. We know that the end of QE3 is fast approaching in October, as the Fed indicated in its most recent minutes. We also know that following the end of QE1 in 2010 and QE2 in 2011 we saw correction of 17% and 21% respectively in the S&P 500.
PD2
It is impossible to quantify how much of a premium the market is trading at with the psychological support of QE underneath it, but let’s assume based on the action in 2010 and 2011 that it is at least 15% higher than it would otherwise be.
Now, we know that institutional investors are not oblivious to this and we also know that they understand that valuations are getting stretched at current levels. In a recent poll of investors, Bloomberg found that 47% of those surveyed believed the equity market was close to “unsustainable levels” while 14% already saw a “bubble.” In the high yield bond market, it the results were even more alarming, with 70% of those surveyed saying the rally in junk-rated bonds was “in a bubble or close to one.”
PD3
Source: Bloomberg Poll
Two Hedge Fund Managers Walk into a Bar
Say we have two hedge fund managers and they are the only active market participants: Hedge Fund Manager A, let’s call him Davy Tepper, and Hedge Fund Manager B, let’s call him Billy Ackman.
Davy and Billy are both heavily long equities and well versed in QE and what happened in 2010 and 2011. While they are both still very bullish on equities, they do not like drawdowns and neither do their investors. They are aware of each other’s existence but are isolated in the sense that they don’t speak to one another before they make a trade.
What are their options here with the equity markets at all-time highs and the end of QE fast approaching? They can 1) remain heavily long (dance until the music stops) and wait until the end of QE to sell, or 2) cheat and sell early while the music is still playing.
A theoretical payoff diagram is below. If Davy and Billy cooperate and stay long, they can have a nice, orderly sell-off at the end of QE with a 5% drawdown. However, Davy doesn’t like 5% drawdowns and neither does Billy. They both would prefer a 0% drawdown and have the other fund suffer a 15% drawdown. They would look like heroes in that scenario. By acting in their own self-interest and selling early, though, they will end up suffering more than had they cooperated, each incurring a 10% drawdown.
PD4
Now I realize that this is a wild hypothetical and many ridiculous assumptions are involved, but let’s think this through for a second.
If one wanted to cheat and sell early what would be the main risk? A market that continued to move higher whereby one would miss out on gains, of course. As we all know, the cardinal sin in hedge fund investing is missing out on upside, even it’s in the very short term. If everyone is down and you’re down too, that’s fine; but if you’re flat when everyone else is up that’s a one-way ticket back to the sell-side.
How to Keep Dancing Without Going to Cash
Is there a way that one can sell early without suffering the consequences if the market continues to rally for some time? Sure, by subtly adjusting one’s beta, or reducing one’s risk. And if I wanted to reduce risk without other funds knowing about it, I would do three things:
1) Move out of more illiquid/higher beta small and micro caps and more liquid/lower beta large caps,
2) Move out of more cyclical sectors like Financials and Consumer Discretionary and into more defensive sectors such as Utilities, and
3) Move into one of the most defensive asset classes, long duration Treasuries.
If we look at the markets in 2014 we can clearly see that many funds are likely already cheating in some form.
First, as I wrote about last week, there is a glaring divergence between large and small cap stocks, with the S&P 500 and Dow still hitting new all-time highs while the Russell 2000 and Russell Microcap indices are down YTD.
PD5
PD6
Second, we are seeing classic late cycle behavior within sectors, with the defensive Utilities sector outperforming while the cyclical Financials and Consumer Discretionary sectors are underperforming. As I wrote about last week, this behavior bears an uncanny resemblance to July 2007.
PD7
Lastly, we are seeing a persistent bid in one of the most defensive asset classes: long duration Treasuries (TLT).
PD8
Not only are they outpacing US equities YTD, but the yield curve has been flattening the entire year, an additional signal of defensiveness within the Treasury market.
PD9
One Foot out the Door
Whether you subscribe to my  Fed game theory or not,  it is important  to recognize what the market is telling us. In no uncertain terms, the big money investors are already preparing for more difficult times ahead with “one foot out the door” rotations into lower beta areas of the market. They may not be going to cash as they still fear missing upside, but they are certainly not going to wait for the end of QE to reduce risk in their portfolios.
Many investors will disregard this message that the market is sending, as they are probably thinking that they are like Drukenmiller and “can get out in a week.” Perhaps, but if the events following 2000 and 2007 have taught us anything, investors are much more likely to overstay their welcome than to sell early. There is now only 100 days left until the Fed’s October meeting where they are expected to announce the end of QE. What will you do?

Thursday, July 24, 2014

Private Debt: The New Alternative For Institutional Investors?


A Preqin report says two-thirds of institutional investors are considering investing in private debt
A new research report from Preqin focuses on the rapidly growing private debt market within the alternatives sector, in particular on how institutional investors are finding value in undertaking financing roles that banks played until the recent financial crisis.
private debt breakdown

Institutional investors’ view on private debt market

The Preqin report surveyed 240 institutional investors to get answers to the following questions:
  • How do institutional investors view the private debt market?
  • Do they consider the segment as private equity, fixed income, or a hybrid of structures?
  • Which fund strategies are most sought after?
  • What do target returns tell us about risk appetite and performance expectations?”
Of note, two out of three institutional investors have invested in or are considering investing in private debt, and 78% of institutional investors look for direct lending funds when investing in private debt.
direct lending capital

Details on survey results

Private debt investment
Breaking down the Preqin survey data, more than two-thirds of institutional investors surveyed are active in or are considering investing in private debt. The reports says this suggests a “continued warming toward the wide array of private debt fund structures.”
The mean current allocation to private debt instruments among survey respondents was 5.6%, with a median allocation of 2.1%. However, 73% said they had no target allocation, “suggesting there may be opportunistic investing in the space, or the allocation is coming from broadly defined pools (Fig. 3)”.
allocation
Moreover, although a growing number of large public firms continue to launch exclusively debt-focused units, many institutional investors plan to allocate to private debt from fixed income (24%), private equity (20%) or general alternatives buckets (19%). The Preqin report mentions that one large U.S.-based pension fund said that they currently have “a private debt allocation of 1.8% of total assets, pulled from a private equity bucket.”

High returns targeted

investors geographic preference
Institutional investors expect to earn strong returns on their private debt investments. Preqin’s survey reported that aggregated target returns for private debt investors generally came out in a range of 8%-14%, with the size of the range “reflecting the variety of investment goals and expectations among LPs.” However, the report also noted that target returns for investors varied significantly by region, with North American investors looking for somewhat higher returns from their private debt portfolio at 9%-15% relative to European fund managers at 7%-13%).

Saturday, July 19, 2014

THE SINGLE BEST PREDICTOR OF EQUITY RETURNS IN 2014?


Market Cap. There continues to be an uncanny relationship between a company’s market capitalization and year-to-date returns. The largest 500 stocks in the Russell 3000 are up an average of 8.5% this year, while the smallest 500 are down an average of -6.1%.
MC1
From the beginning of July, when the small cap Russell 2000 Index peaked, the differential has been stark, with the top 500 stocks only marginally lower while the bottom 500 are down over -5%.
MC2
What is driving this incredibly strong relationship between market cap and return?
It can be explained in part by a simple reversion to the mean as last year the smallest stocks (microcaps) widely outpaced the S&P 500 and we are seeing a complete reversal thus far in 2014.
MC3
But there is more to the story here. As I have been writing about since January, small caps had been outpacing large caps for over fifteen years. This incredible run has left their shares extremely stretched on both an absolute and relative valuation basis.
MC4
One could quite easily make the argument that small cap valuations are at/near their most extreme in history (See: “US Small Cap Rally Sends Valuation 26% Above 1990’s”). Indeed, one of the smartest minds in the investment business, Jeremy Grantham of GMO (with over $100 billion in AUM) is projecting U.S. small caps to have a negative real and absolute return over the next seven years.
MC5
This suggests that the underperformance in small caps this year may not be a short-term phenomenon and could very well continue for some time. It also suggests that small-cap effect that many have become accustomed to may be absent for a while, at least until valuations are normalized.
What does this mean for the broad markets? For now, market participants remain highly bullish and are largely ignoring the small cap weakness, focusing instead on the all-time highs in the Dow (DIA) and S&P 500 (SPY).
Many of these participants are pointing to March and April of this year when small declined in consecutive months while the large cap indices continued higher as a template for what will happen next.
MC6
While this is certainly possible, I would caution investors against assuming this is high probability and a normal market relationship. It is not. As I wrote back then, this was the first time in history that such a consistently wide divergence had occurred.
Also, if you believe that small caps are declining because of valuation concerns, wouldn’t it stand to reason that investors will soon become concerned with large cap valuations? After all, while large caps are cheaper on a relative basis, they are anything but cheap on an absolute basis, as evidenced by the negative real returns expected by Grantham over the next seven years.
I would also note that despite the daily headlines about all-time highs, the most defensive area of the market, long duration Treasuries (TLT), continues to widely outperform. We are also seeing other signs of classic late cycle behavior, as I wrote about recently in showing the troubling similarities to July 2007.
MC8
Overall, the rotation out of small and micro caps should not be ignored by market participants. It is a clear sign of defensive behavior and is likely to have ramifications on investor returns not only in the near-term but for years to come.

Tuesday, July 08, 2014

Lunch is for wimps

Lunch is for wimps
It's not a question of enough, pal. It's a zero sum game, somebody wins, somebody loses. Money itself isn't lost or made, it's simply transferred from one perception to another.