Tuesday, October 28, 2014

Soc Gen ‘Hedge Funds Left Naked By Market Correction’

Increasing volatility caused pain on short volatility plays in equity markets, hedge fund stops were hit as margin calls gave hedge funds a tougher ride down than going back up

It might seem odd that Societe Generale’s latest Hedge Fund report decries the lack of performance in hedge funds when a category it should be intimately familiar with, managed futures, continues to perform during crisis.  The report titled ‘Hedge Funds Left Naked By Market Correction’ nonetheless provides significant insight into the current state of hedge fund positioning, if tilting slightly towards those equity-based hedge funds that have historically dominated Wall Street thought processes.
Hedge Funds net positions
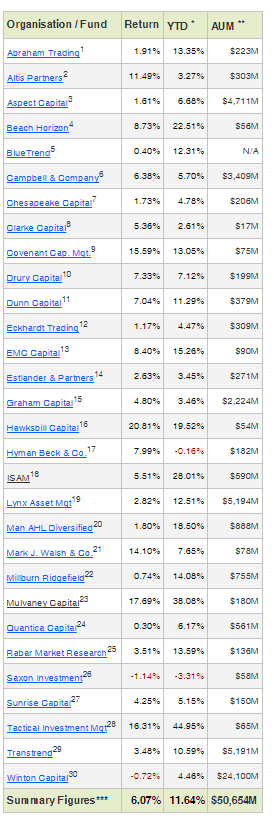
The report of hedge fund trade positions is always considered interesting as Newedge, Soc Gen’s derivatives brokerage holding, has access to many of the top algorithmic traders. It is odd, then, that at a time when the Newedge CTA Index is up by 0.10 percent month to date (as of October 23), the report indicates hedge funds are generally suffering during October.

Hedge funds exposed to the bond market correction

As a result of rising U.S. bond yields and long dollar trades, hedge funds were “exposed” to the correction.  “Even diversification can be of little help, as trades in many different asset classes go south simultaneously, leaving one feeling rather, err, exposed,” the report quipped.  What is one hedge fund’s exposure is another hedge fund’s opportunity.
Hedge Funds bonds
There are several factors that the Soc Gen report says could lead to a hedge fund fail in October. This can be broken down into two basic categories that are most interesting: Hedge fund expectations of rising US bond yields (and related market trends, particularly in currencies) and volatility.

Hedge funds’ expectation for rising U.S. interest rates

The expectation for rising U.S. interest rates is in some cases viewed as a market crash hedge, a debt crisis play. At some point the math of government debt, the momentum of which appears can’t be stopped, overwhelms the ability of a sovereign nation to pay its debt obligations. At one point this thinking was considered “crazy,” but it was really crazy only to those who didn’t do the math. It is for this reason that certain hedge funds have a long interest rate play (and some have a general long volatility play) in their risk management plans.
Hedge Funds Treasuries
While the interest rate hedge may have cost money in October – as the bet on higher interest rates met the gravity of stock market investors looking for safety in a falling stock market – that play continues to be a risk management concern.  The report noted that short treasuries was already a crowded play, showing the popularity of the interest rate hedge, but “then rates fell again. Ouch!” says the report.
Hedge funds also got hit by rising volatility, the report said, noting that certain hedge fund VIX positions were required to be sold during the recent volatility spike. But perhaps the more specific issue certain hedge funds faced was their short option put positions on individual stocks.  The report noted “hedge funds typically make money on short equity volatility positions.”  In some cases, this is a strategy that can materialize in a short put long stock relative value trade, also commonly known as a “Texas hedge” in certain derivatives circles. When the stock market is rising the long equity position gains value while the short put position loses value. Since the investor is long the stock and short the put option, it’s a win win. Typically this strategy is used at a point when the investor is willing to go long additional stock. (See Netflix stock acquisition strategy from Mark Cubin for an example.)
Hedge Funds equity volatility
Volatility causing traditional equity hedge funds difficulty
While Soc Gen noted volatility causing traditional equity hedge funds difficulty, it has benefited certain volatility hedge fund traders.  The Typhon Proteus Dynamic Volatility hedge fund, under the supervision of derivatives executive James Koutoulas, is doing well in October.  The volatility program, one of four programs Typhon manages, is up 2.49 percent on the month, outpacing the Newedge CTA index.  Attain Portfolio Advisors Trend Fund is up 9.89 percent this month and Walter Gallwas, president and founding partner of the firm, notes the entire managed futures space has been doing well.
Soc Gen interestingly noted that many hedge fund traders were stopped out on their trades, the old “margin call,” and may suffered more to the downside than to the upside.
Hedge Funds currencies
One of the hedge fund relative value trades that has been popular among certain algorithmic spread strategies is the short gold long platinum relative value play. Copper and gold started to break down with a volatility spike in early to mid July. Big up volume followed by even bigger down volume, that wasn’t confirmed in the high value metal category, indicated that a reversion from the mean in the price relationship could ensue.
Hedge Funds strategies

Hedge funds gains with commodities

This thesis is confirmed to an extent in the positive relative value hedge funds afforded platinum and the relatively negative view of copper.  Wheat and soybeans also saw negative weighting from hedge funds, but what didn’t make the report was the positive uptrend in cattle, which has been the focus of certain relative value trades as well.
The report was fascinating, but what would be equally interesting would be to see the proportion of traditional equity-based hedge funds in the study vs. the number of true algorithmic long / short programs.
Hedge Funds us equities

Thursday, October 23, 2014

Look Who Decided to Show Up to the Party…

We’ve done testing going back 100 years or so (so has AQR in their paper ) and I was delighted to see a new book out by the crew at ISAM (up a whopping 28% this year) that has a 800 year backtest!  Looking forward to reading it.

If you want some background reading on Trendfollowing search the archives, lots and lots in there including some of the below:

Podcast interviews that are excellent
Dual Momentum Investing – Antonacci
Following the Trend – Clenow
Trendfollowing Bible – Abraham
Global Investment Returns Yearbook – Dimson, Marsh, Staunton
Trendfollowing – Michael Covel
The Capitalism Distribution – LondBoardFunds

returns
- See more at: http://mebfaber.com/2014/10/21/look-who-decided-to-show-up-to-the-party/#sthash.qr8sG2g1.dpuf

Wednesday, October 08, 2014

Here’s The Problem With Underperformance


“A relative-performance-oriented investor is generally unwilling or unable to tolerate long periods of underperformance and therefore invests in whatever is currently popular.” – Seth Klarman
Active mutual funds continue to lag the market this year. This chart from BMO Capital Markets, courtesy of MarketWatch, shows the percentage of active stock managers that are outperforming the market over the past six years or so:
Active
This is nothing new, but there are some risks for investors in active funds to consider that can result from this underperformance. Brian Belski, the chief investment strategist at BMO, had this to say about the implications of these numbers:
We believe fund managers being too inactive and defensive with their portfolio positioning this year is largely responsible for this. However, given the level of underperformance, fund managers will likely have an added incentive to position portfolios more aggressively between now and year-end to play “catch-up” – something we believe will be a strong positive for market performance.
Ignoring the market implications (why would the market go up just because portfolio managers shift their stock holdings around?), this brings up a risk that few investors consider when making fund selections – career risk.
Whether right or wrong, if you underperform the market for an extended period of time, it will be much harder to attract new investors and keep current investors from selling out of the fund. Lower assets means lower fees which all compounds into more and more pressure on the manager to bring returns back up to stop the bleeding.
The risk for investors in underperforming funds is exactly what Belski outlines here – which is that portfolio managers take more risk to try to make up for their underperformance. Once a manager becomes fixated on short-term relative performance, risks can become magnified. Instead of performing rational analysis, they turn into speculators. They speculate on what other investors are going to do and try to get their first. They’re trying to forecast what the other forecasters are forecasting.
In essence, when you play the short-term relative performance game, you have to be able to guess the psychology of other people…not an easy task.
Obviously, this isn’t an optimal way to run a portfolio. This is why it’s so important for investors to understand what they are getting themselves into with any fund offering. A few points to consider when you’re involved with an underperforming fund or strategy:
Does the portfolio manager/firm have a disciplined process? A deep understanding of the fund and strategy is always important, but this is especially true when a period of poor performance hits. You must consider whether the manager will stick to their knitting or change course and go a new direction. Style drift is acceptable when it’s been sold as part of the strategy, but that’s rarely the case. More often than not style drift is a huge red flag for an underperforming fund.
Do you have the correct expectations for fund performance? Being out of favor isn’t that surprising. Nothing outperforms forever. Just as markets are cyclical, so too are strategies and investment styles. These things go in and out of style. It all depends on how willing you are to wait for things to turn around, which may or may not happen.
Do you have a plan for an underperforming fund? There’s no easy answer to the question of when to cut your losses in an underperforming fund. Investors always preach process, process, process until a bad outcome hits. At that point, process goes out the window and emotions take over. Emotions are the enemy of buy and sell decisions.
Playing catch-up to the market isn’t a great position to be in from a fund manager’s perspective. But adding risk for the sole purpose of getting even is not the solution.
Remember, trying harder doesn’t lead to better returns in the market.

ANATOMY OF A MARKET TOP

“If it keeps on rainin’, levee’s goin’ to break.” – Led Zeppelin 
Crashes get all the headlines, but the reality is that a breakdown in markets is more often a process than an event. It takes time to break the back of a strong uptrends as there are many buyers on the sidelines eager to “buy the dip.” This is why you tend to see a period of back and forth, a rotation from strong hands to weak hands, before the sharper declines ensue.
If we look at the average stock in 2014 as reflected by the Russell 2000 Index, this is precisely what we have been witnessing for the entire year.
Top1
Where have we seen this before?
2000…
Top2
2007…
Top3
The First 7 months of 2011…
Top4
But It’s Different This Time
The perception today is that it’s different this time. This belief stems from the view that the Fed has repealed the business cycle and eradicated market corrections through nearly six year of 0% interest rates and multiple rounds of quantitative easing. The validation for this narrative comes in the form of price action and the longest uptrend in the history of markets. At 471 trading days above the 200-day moving average in the S&P 500, most cannot remember a time when equities did anything but go up.
Streak 10-8
Perhaps the Fed true believers are right, you say, and the uptrend will last forever. Anything is possible in markets but the more likely scenario is that it’s finally coming to an end here.  The sustained weakness in small caps, high yield credit, and cyclical sectors is becoming too much for large caps to ignore (see here for comparison to 2007).
Small caps, mid-caps, Emerging Markets, and European equity markets have all tested their 200-day in recent days/weeks. All that remains is large caps; it is the last shoe to drop. I have been arguing for much of the year that investors have been rotating into U.S. large caps and defensive areas, hiding in anticipation of the end of QE in October (see “Fed Prisoner’s Dilemma”).
Well, October is here and investors may soon come to understand that U.S. large caps are not a risk-free asset class, in spite of what Fed has done over the past six years.
The chart below of the Russell 2000 is likely to become very important in the coming months. It illustrates the back and forth action that is reminiscent of 2007.
I’ve heard a number of perma bulls call this a “beautiful consolidation,” just a pause before the next sharp move upward. Perhaps, but if they are wrong and the levee of support (YTD lows in February and May) is broken, there could be significant downside ahead.
Top6
Will it break or will it hold? On this question I’ll defer to the wisdom of Page and Plant: “If it keeps on rainin’ [negative intermarket relationships persist], levee’s goin’ to break.”

Tuesday, October 07, 2014

Global Diversification: Accepting Good Enough to Avoid Terrible


The U.S. stock market is once again trouncing the broader international markets this year. Through the end of September, the total U.S. stock market, as measured by the Vanguard Total Stock Market Fund, is up nearly 7% while the Vanguard Total International Fund is basically flat on the year.
Since the beginning of 2013, the U.S. market it up almost 43% against a 15% gain for foreign markets. It’s tempting to look at these numbers and assume you’ll be fine just holding U.S. stocks and forgetting about the rest of the globe.
Investors have a short memory at times, so it’s easy to forget that everyone hated U.S. stocks in the middle part of the last decade as foreign stocks, led by emerging markets, were up almost three times as much on a total return basis:
Intl 4
Over the entire 2002 to 2014 period the total returns are fairly close, with the U.S. market up 139% against a gain of 133% for international stocks. These numbers show how mean reversion works over time.
It’s also instructive to break out the international markets by different regions to show how certain geographies have performed over time. MSCI data goes all the way back to 1970 and they have an index for both Europe and the Pacific region (made up of Japan, Australia, Hong Kong and Singapore).
Looking at the performance of these two markets along with the S&P 500 over forty plus years, we find that the annual returns are fairly similar:
Intl 3
Any long-term investor would have done great in these markets had they been invested over the entire time frame. But breaking the numbers down by different periods shows how cyclical the annual returns have been over time:
Intl 1
Until the latest period, European stocks have actually been the most consistent performers while the U.S. and Pacific markets have taken turns going from top to bottom.
These numbers are a good reminder of why it makes sense to diversify globally and avoid a home country bias. There could be long stretches of severe underperformance if you invest in a single geography at the wrong time.
No one can predict if U.S. returns on stocks will be as high as they’ve been historically or if another country or region will outperform in the coming decades. There are far too many factors that are unknown.
It’s impossible to know ahead of time if the down periods in one market will coincide with your spending needs when you need to start drawing down your portfolio. Selling in a down or underperforming market only compounds your problems when a market runs into a bad stretch.
Not only are there long stretches of underperformance for some regions, but there is Japan-style underperformance which is in a league of it’s own. Japan currently makes up about 60% of the MSCI Pacific Index so it makes for a pretty good proxy. Here are the annual returns for the Pacific Index and  S&P 500 broken out by pre- and post-Japanese bubble:
Intl 2
Anytime you bring up the benefits of being a long-term stock investor, someone will play devil’s advocate by pointing out that Japan has been a terrible long-term investment for some time now. But it really depends on your definition of long-term because the returns are so close over the entire data-set.
Sometimes it comes down to luck and what period you happen to be saving and investing your money in. You have no control over this whatsoever. Pacific shares were an amazing investment for two decades, but have been working off those excesses ever since.
It would be great if we were all guaranteed a smooth ride with no variation in performance, but markets don’t function that way. They’re extremely cyclical and can go from worst to first and back again over any month, quarter, year, decade, etc.
It’s intelligent to utilize diversification so you don’t get stuck with a portfolio that only earns the Pacific returns since 1990. You have to give up the chance for exclusively earning the returns from 1970-1989, but that’s the trade-off.
Diversification is about accepting good enough while missing out on great but avoiding terrible.

Why the Gross vs Ivascyn comparison is misleading


A lot has been made of the track records of Bill Gross and Dan Ivascyn managed funds since the sudden departure of Gross from PIMCO. Mainstream media has covered the aftermath in great detail, but explanations of the performance have gone relatively untouched. Was the performance of Bill Gross really that awful? Was it entirely attributable to a poor call on US Treasuries? Is the Ivascyn magic touch now about to change all of PIMCO’s bond funds? Let’s sort through the facts and establish some pragmatic views on the subjects.
1. Ivascyn knocked it out of the park
Make no mistake about it, the management of Dan Ivascyn’s funds the since the crisis has been nothing short of superb. The PIMCO Income Fund (PIMIX) is up an average of 12.8% over 5 years versus the category average of 7.2%, ranking it better than 99% of peers according to Morningstar. Fund assets grew from $300mil in 2008 to $6.5bil at the end of 2011, and now $38.6bil at the end of September 2014.
Ivascyn and co-PM Alfred Murata targeted beat up credit assets that would benefit from a reflating of the financial markets. As central banks moved interest rates to zero and removed government bonds from the system, investors were forced to incrementally move out the credit curve.
An example of something that PIMIX has owned and done extremely well on is Spanish Covered Bonds. This is one the larger holdings in PIMIX. As shown, in three years, the price has risen from ~50 cents on the dollar to ~120 as the Euro debt crisis calmed.
image
Arguably the largest source of returns for the PIMCO Income Fund has been from non-agency MBS. There’s been arguably no better place for outsized returns in fixed income than non-agency MBS since 2009. Ivascyn and team made shrewd bets that these assets would recover and they did.
All in all, Ivascyn’s bets have been credit related and have centered around risk premium compression in the junkiest areas of credit. He has not been without misses - as his PIMCO funds held large amounts of Brazilian entrepreneur Eike Batista’s bankrupt OGX, as well Mexican homebuilder Homex. The point is not that he got a few wrong, but that he bet big on a recovery in the weakest areas of the credit markets and has largely been correct. Gross himself recognized & apparently liked this opportunity set as he is the largest owner of the Ivascyn managed PIMCO Dynamic Income fund (I consider it a leveraged version of PIMIX) with over 1.6mil shares held.
2. Gross’ Total Return Fund was not comparable to Ivascyn’s Income Fund
The objective of the PIMCO Total Return Fund is to "maximize total return, consistent with preservation of capital and prudent investment management. The fund invests at least 65% of its assets in investment grade fixed income".
The objective of the PIMCO Income Fund is to "maximize current income and to seek for long-term capital appreciation…"
These objectives are not anything similar to each other. The Gross managed Total Return Fund by mandate must seek preservation capital and may only hold a maximum of 35% in non investment grade bonds. In contrast, the Income fund is seeking to maximize current income and long term capital appreciation.  Gross was forced to hold a substantially larger amount of government bonds and lower yielding IG credit.
3. Even if he wanted to, the Total Return Fund was too large to buy the bonds that Ivascyn bought
Peaking at $293billion, the Total Return Fund is an absolute behemoth. Bottom line is that the types of bonds which had the most outsized returns (such as non-agency MBS) were not able to be purchased in great enough size to move the needle.
The size of the entire non-agency universe has fallen to under $750billion. After accounting for legacy holders, hedge funds, and banks, the universe to buy is very small. As an example, the large Maiden Lane auctions where the Government sold off amounts of non-agency MBS were only around $7bil if I recall correctly.  If the Total Return Fund bought that whole thing it still would’ve been a very small allocation to the fund. 
4. The performance of the Total Return Fund was largely based on duration calls
With a fund so large as Gross managed, the relatively performance of it came down to his call on duration. It’s been well documented that he was wrong about US rates a few years ago and that lack of duration hurt his relative performance. Regardless of QE or “the new normal”, his views on how much duration to take was the big determinant. He bet that rates would rise and inflation would as well (Gross funds were heavily long TIPS).
Yes, Gross and team made some mistakes but comparison to Ivascyn’s funds are misleading. They were playing in very different areas of the bond market and the size of Gross’ Total Return Fund were a big headwind. Astute readers will note that Ivascyn isn’t on the PM team for the Total Return fund & that’s probably a smart choice. Ironically, as Gundlach mentioned yesterday, the biggest mistake that Gross made might have been letting his flagship fund get too large.

Sunday, October 05, 2014

Tech Stocks help Hedge Funds justify their Existence


How important is the tech-sector to hedge fund value added? Far more than their allocations would suggest.
Tech’s share of the S&P 500 is roughly 17%, and on the face of it, according to the Symmetric universe, hedge fund investors are only slightly overweight technology, coming in at 19%. 
But the tech-sector contributes more than 27% of the total stock picking dollar value generated by hedge funds. Some 27% of all the dollars that the hedge fund industry generated picking stocks that outperform their corresponding sector come from picking tech stocks. It’s far more than the contribution from any other sector and, given the allocation, far more than you would expect.
image
Either hedge funds tend to be good at picking stocks in the technology industry or technology stocks may just be more conducive to the investment strategies employed by hedge funds.

The Ten Golden Rules of Argument


​​You don’t have to attend every argument you’re invited to.” — Anonymous
Arguments are tricky. We spend a lot of our time trying to persuade others. We think that if we show them the facts that we have they will, logically, reach the same conclusions we did. Unfortunately that’s not how it works. When is the last time someone changed your mind this way? 
Sometimes we don’t want to argue. We’d rather avoid. This doesn’t make the problem go away. In fact the suppressed resentment that builds up can poison a relationship.
In his book, How to Argue, Jonathan Herring outlines positive ways of understanding and looking at arguments.
They needn’t be about shouting or imposing your will on someone. A good argument shouldn’t involve screaming, squabbling or fistfights, even though too often it does. Shouting matches are rarely beneficial to anyone.
We should treat the ability to argue as a skill that needs to be practiced and developed.
​​“The aim of an argument, or of a discussion,
should not be victory but progress.”
— Karl Popper
Arguments, and for that matter discussions, should be about seeing things through the other person’s eyes. They should lead to a better understanding of another person’s view.
With that in mind, here are what Herring calls the Ten Golden Rules of Argument.
1. Be prepared
Make sure you know the essential points you want to make. Research the facts you need to convince your opponent.
Also, Herring advises: “Before starting an argument think carefully about what it is you are arguing about and what it is you want. This may sound obvious. But it’s critically important. What do you really want from this argument? Do you want the other person to just understand your point of view? Or are you seeking a tangible result? If it’s a tangible result, you must ask yourself whether this result you have in mind is realistic and whether it’s obtainable. If it’s not realistic or obtainable, then a verbal battle might damage a valuable relationship.”
2. When to argue, when to walk away
I’m sure you’ve had an argument before and later felt that it was the wrong time and place. “Knowing when to enter into an argument and when not to is a vital skill.”
Think carefully before you start to argue: is this the time; is this the place?
3. What you say and how you say it
Spend time thinking about how to present your argument. Body language, choice of words and manner of speaking all affect how your argument will come across.
One clever thing to do here, that shows you’ve done the work, is to address the arguments against your position before they arise.
4. Listen and listen again
Listen carefully to what the other person is saying. Watch their body language, listen for the meaning behind their words.
As a general rule, Herring writes, “you should spend more time listening than talking. Aim for listening for 75 percent of the conversation and giving your own arguments 25 percent.” And listening doesn’t mean that you’re thinking about what you’re going to say next.
This is often where a lot of arguments, and discussions for that matter, veer off course. If you’re not listening to the other person and addressing their statements, you’ll just keep making your same points over and over. The other person won’t agree with those and the argument quickly becomes frustrating.
5. Excel at responding to arguments
Think carefully about what arguments the other person will listen to. What are their preconceptions? Which kinds of arguments do they find convincing.
There are three main ways to respond to an argument: 1) challenge the facts the other person is using; 2) challenge the conclusions they draw from those facts; and 3) accept the point, but argue the weighting of that point (i.e., other points should be considered above this one.)
6. Watch out for crafty tricks
Arguments are not always as good as they first appear. Be wary of your opponent’s use of statistics. Keep alert for distraction techniques such as personal attacks and red herrings. Look out for concealed questions and false choices.
7. Develop the skills of arguing in public
Keep it simple and clear. Be brief and don’t rush.
8. Be able to argue in writing
Always choose clarity over pomposity. Be short, sharp, and to the point, using language that is easily understood.
9. Be great at resolving deadlock
Be creative in finding ways out of an argument that’s going nowhere. Is it time to look at the issue from another angle? Are there ways of putting pressure on so that the other person has to agree with you? Is a compromise possible?
10. Maintain relationships
This is absolutely key. What do you want from this argument? Humiliating, embarrassing or aggravating your opponent might make you feel good at the time, but you might have many lonely days to rue your mistake. Find a result that works for both of you. You need to move forward. Then you will be able to argue another day.
Another approach to end arguments is to simply ask the other person to explain their thinking.

A Poor End to a Bad Month


With the month of September and the third quarter now in the books, below is a look at the performance of various asset classes using key ETFs traded on US exchanges.  It was a rough month for stocks, especially for smallcaps.  The Russell 2,000 (IWM) finished the month down 6.19% and the quarter down 7.96%.  
Six sectors finished the quarter lower, while four traded higher.  Health Care and Technology were the winners of Q3, while Energy was the big loser.
Foreign markets didn't fare well in September either.  The Brazil ETF (EWZ) was by far the worst with a decline of 19.09% for the month.  Australia (EWA) fell the second most at -11.86%.
Commodities and fixed income fell as well in September.  For the quarter, commodities took it on the chin, with declines of more than 10%.  
About the only thing that did well in September was the US dollar index.

Not new: Money has been leaving PIMCO TR for a while....


Shorting GoPro Is One Pricey Bet


Short sellers have to pay a pretty hefty premium these days to bet against camera maker GoPro Inc.
GoPro’s stock has more than tripled from its trading debut in June and is the best-performing U.S.-listed initial public offering this year, according to Dealogic. The rally has made GoPro a ripe target for short sellers to bet on a drop from such elevated levels.
But to do that, the shorts need to pay a hefty price tag.
“GoPro is currently one of the most expensive stocks to borrow among all U.S. equities,” Andrew Laird, analyst at securities-financing tracker Markit, said in an email to MoneyBeat. Nearly all of the shares available for lending have been borrowed, he said, and the cost to borrow the stock has surged to among the highest levels since GoPro’s IPO in June.
“Currently investors are willing to pay close to 100% (annually) of the value in order to borrow shares,” Mr. Laird said. “This is extremely high by any standard and is a factor of both strong demand to short from the buyside and limited supply.”
Short sellers borrow shares to sell them in hopes of buying them back cheaper at a later date, aiming to profit from a price decline.
While the demand for shares to short is pushing against the available supply, the percentage of GoPro shares on loan — a proxy for short-selling activity — isn’t wildly outside the norm. As of Wednesday, it stood at about 2.5% of shares outstanding, according to Markit. That’s above the average short interest for the S&P 500 at about 2.2%.
Markit
GoPro makes wearable high-definition videorecorders that first appealed to surfers and cyclists seeking ways to record cool tricks before surging in popularity among the general public.
Shares are up about 250% from GoPro’s $24 IPO price. But trading in the stock also has been erratic. The stock fell as much as 14% on Thursday after the company said its founder, Chief Executive Nicholas Woodman, and his wife, Jill Woodman, gave 5.8 million Class A shares worth about $500 million to a charitable foundation.  The couple had been restricted from selling the shares until six months after the June IPO, but sidestepped a so-called lockup agreement and transferred the stock.
Shares rose about 11% on Sept. 29 after the company unveiled a slew of new cameras. The stock also fell 15% on Aug. 1 after the company reported earnings.
GoPro shares rose 3.1% to $88.14 Friday afternoon.

Lunch is for wimps

Lunch is for wimps
It's not a question of enough, pal. It's a zero sum game, somebody wins, somebody loses. Money itself isn't lost or made, it's simply transferred from one perception to another.