Tuesday, June 30, 2009

A Wild Ride So Far

lf you went to sleep at the end of 2008 and just woke up today, you'd see the S&P 500 up 1.78% for the year and probably assume it's been a pretty boring six months in the market. Oh how you'd be wrong, however. As shown below, the market has taken investors for a wild ride so far this year. On March 9th, the index closed the day down 25% for the year. From March 9th through today's close, the index has rallied 36%. Down 25% and then up 36% turns into up 1.78% at the midway point.

Spx09

And while the S&P 500 is up as a whole, only three of the index's ten major sectors are positive in 2009. Technology has been the big winner so far with a gain of 24.08%. Materials is up the second most at 12.28%, and Consumer Discretionary ranks third at 7.52%. And even though sectors like Industrials and Financials have been going up for months now, both are still down for the year. The Industrials sector is down the most at -7.68%, while Financials are down 4.76%.

While the year started off horribly for the market, it is heading into July in a nice uptrend even though it has been floundering for a few weeks now. While some investors are getting frustrated with the market's inability to break to new highs, they easily forget how bad things were just a few months ago. Up 1.78% in '09 with everything that has happened -- we'll take it!

09mid

Sunday, June 28, 2009

Wrong Only

The liquidity crisis is over while the credit crisis is still ongoing.
How to make money and to protect capital in this environment remains
to be the question. Dominant forces (partly working against each other)
are de-leveraging, saving and high demand for cash, re-deployment of cash
into equities and risk markets, artificial economic stimulus effects,
inventory liquidation, decreasing earnings due to economic weakness and
and lower leverage.

Long only managers have in particular been challenged, given that most
of them went fully exposed into the downturn. And ironically they had
such large exposure even without the direct application of leverage to
their portfolios. However, since equity is a leveraged asset class per se
(especially when it comes to finanicals) their losses were very competitive
compared to other strategies. Changing risk appetite helped some of them to
partly miss out the upside of the quick bounce. Now a lot have re-deployed
cash which was sitting on the sidelines to chase performance even when
there is very weak fundamental support to the harsh up-move.

How much sense does the long only approach make going forward and how much
faith will investors have? In my view it makes more sense to apply a more
flexible approach. Historical perceptions based on historical data should
give way to a more opportunistic and selective approach. Shortened time
horizons with a focus on price discrepancies and taking money off the table,
when asset getting close to being rich. The use of shorting, hedging, leverage,
and using derivatives all seem to make perfect sense to me.

Killer Chart on foreign investor demand for US government sponsored debt

Look at this chart which shows how foreign investor demand for
Freddie Mac debt has crashed from 50% to 20% within one year!


So far there seemed to have been a common believe that demand for U.S. securities
will hold up sufficiently well. This is mostly based on the fact(oid) that US
securities markets are so deep and liquid, far developed and well ruled by law,...

I broadly agree but submit a few more charts showing the same trend on other
types of U.S. government related debt and I will think twice. And so may others
which would be reflected in market prices. Generally I am optimistic that US
funding will be addressed but there seems to be a fast growing need to work on
and formulate an exit strategy.

Stock Prices Devided by a Ten-Year Moving Average of Earnings, 1880-2009

Friday, June 26, 2009

VIX Makes A New Short-Term Low

Yesterday's equity market rally sent the VIX volatility index to a new short-term low of 26.36. While the VIX made a new low, the S&P 500 still has a ways to go before taking out its recent highs. Hopefully the VIX is a leading indicator that the rally is set to continue.

Vixspx625

Thursday, June 25, 2009

Individual Investors Most Bearish Since March Lows

It doesn't take much to rattle investors these days. Following a decline of less than 6% from its highs, sentiment of individual investors is at its most bearish level since the March lows. Based on this week's survey from the American Association of Individual Investors (AAII), 28% of investors are bullish while 48.8% are in the bearish camp. The current bull-bear spread of negative 20.8% is the lowest level since the week ending March 12th. While single-day market declines of 6% were commonplace less than six months ago, given the scars of the bear market, a multi-week pullback of less than 6% is enough to send the bulls heading for the hills.

Aaii0625

Two Strategists Up Their 2009 Price Targets

Each week Bloomberg surveys Wall Street strategists for their year-end S&P 500 price targets. Since we last updated our table highlighting the various price targets a few weeks ago, two firms have upped their year-end numbers. Deutsche Bank's Binky Chadha upped his price target from 900 to 1,060, while Morgan Stanley's Jason Todd upped his from 825 to 900. The average year-end target for the S&P 500 is now 968, which is 5.59% above the index's current level.

Strategist

Wednesday, June 24, 2009

Country Inflation Rates

For those interested, below we highlight a big bar chart showing the most recent inflation rates for 77 countries. The average unweighted inflation rate for all of the countries is 4.11%. Fifty-nine countries are currently seeing prices rise versus a year ago, 14 are seeing prices decline, and 4 are flat. Venezuela has the highest inflation rate at 27.7%, followed by Kenya, Iran, Ukraine, Pakistan, Guatemala, and Russia. Ireland is seeing the most deflation with a year over year decline in prices of 4.7%. China has the third biggest decline in prices at -1.4%, while the US is right behind at -1.3%. Whether or not you use this chart to make any investment decisions, it does provide a good look at where each country stands in regards to price movements.

Cpi

A two sigma day

A two sigma day on the S&P 500, from Condor Options. Click to enlarge.

Here’s a bit of an explanation from Condor:

The lower part of the chart below shows how far each day’s price movement deviates from its 21-day mean; the dotted lines mark two standard deviations up and down. With SPX at 895.70, today looked to be one of those two sigma days. The last such occurrence was on March 2nd of this year, a few days before what the “green shoots” crowd desperately hopes will have been the market bottom. . . .

A two sigma event isn’t outrageously improbable or anything like that. We’re not really talking fat tails here.

Rather, in this case, it just suggests — perhaps — that volatility is returning to the market or momentum is picking up.

Or maybe, it just suggests that stochastic analysis is bunk.

Either way, we think it’s interesting.

On Goldman’s fat tail risk

Zero Hedge points us in the direction of a risk management presentation from Goldman Sachs.

The majority of slides are typical management-type stuff. There are some impressive Venn diagrams and graphics of interlocked puzzle pieces, as well as a few intriguing comments on mark-to-market accounting, but the most interesting thing, we think, is the slide on fat tails and Value at Risk, or VaR.

VaR is a way of measuring the risk of loss on a portfolio, using observations of historical market movements, with the VaR model used by Goldman Sachs looking at 95 per cent and 99 per cent tail risk. Tail risk is the the ‘unexpected’ losses or gains that happen to the portfolio, assuming normal distributions.

In the three months to March 27, 2009 Goldman’s VaR value was $240m at the 95th percentile. Meaning there was a 5 per cent probability Goldman’s portfolio would fall in value by more than $240m over a one day period. That compares with a VaR value of $197m in the three months to November 28th, 2008, and a VaR of $157m in the three months to February 29th, 2008 (Goldman Sachs, we all remember, conveniently changed its reporting period).

In any case, here’s the fat tail slide from Goldman’s risk presentation:

And here’s Zero Hedge’s commentary:

. . . the fat tail analysis is also somewhat non-self explanatory. As the chart [above] indicates that Goldman is dead set on analyzing the 99 percentile (in addition to the 95%) non-fat tail distribution. Does this explain the meteoric rise in VaR in recent reporting periods? Also - what happens on that rare 100th day, week, month? Especially if there is nobody left to bail you out.

The rise in VaR, we think, is explained by the below slide from the same presentation, which shows the illiquidity in recent market environments and an example of a crowded trade — when investors rush to unwind their positions simultaneously — in the form of the notorious Volkswagen short squeeze of death.

Tuesday, June 23, 2009

Kass: Three Summer Scenarios

Doug Kass

06/22/09 - 11:00 AM EDT
This blog post originally appeared on RealMoney Silver on June 22 at 7:58 a.m. EDT.

Summer has set in with its usual severity.

Similar to many, I am trying to grapple with the market's outlook for the next few months.

From my perch, the short-term market mosaic is particularly hard to decode. Indecision reins and is reflected in a relatively range-bound market, with the S&P 500 having been contained between 875 and 950 since early May and activity characterized by lackluster volume.

In summary, I have concluded that a sideways correction or a deep correction are most likely, with a combined probability of 75%, and that a continued rally holds about a 25% probability.


Scenario No. 1: The Sideways Correction (Probability of 40%)

I have previously suggested that a sideways correction remains the most likely market outcome this summer. As a metaphor, consider the market as a big bathtub with little new water (hedge fund and mutual fund inflows) being added into it. The bathtub market's water level remains stable, but the water swishes around from side to side as the bather moves. Industry rotation is the hallmark condition. The market, however, does not take a bath as, over the short term, extended sectors such as industrials, materials and energy will likely correct as more defensive sectors improve in their relative performance. A sideways correction would be intermediate-term healthy in the sense of correcting an overbought from the March lows and will likely presage a move higher in the autumn.

Scenario No. 2: The Deep Correction (Probability of 25%)

Fundamentally, a continued weakness in retail spending could precipitate lost confidence and a deeper dive. So could weakness in business spending (as a byproduct of ever lower capacity utilization rates). Technically, a reversal in the Coppock Curve indicator -- it gave a technical buy at the end of May and is now in a sell mode -- and weakening Lowry's buying power augur for a plunge. It is important to recognize that a deep correction, similar the sideways correction, would also be healthy for the market's back-end-of-the-year market prospects.

Scenario No. 3: The Continued Rally (Probability of 35%)

While giving the scenario only slightly better than a one-third chance, a new up leg is not out of the question. If the replenishment of depleted corporate inventories begins to occur in July, evidence of an impending production boom could be interpreted by market participants as a sustainable economic leg higher (an outcome with which I happen to disagree), which will carry expectations of improving corporate profits. With the appearance that the domestic economy is moving from "less worse" to "better," fixed-income yields would then rise. (The yield on the U.S. 10-year note could as high as 4.25% or 4.50%.) And, as I have emphasized, a large pension fund reallocation out of fixed income into equities could serve as a catalyst to energize stocks and take the averages through the upside of their recent trading range.


Looking beyond the near term, I would emphasize that I view the two correction scenarios as bolstering the market outlook during the fall-winter period. Both scenarios would serve to build up skepticism, shake up complacency and make it difficult for many investors to get back in. A sideways correction would frustrate the most and wear many investors out. A deep correction would again increase the fear of being "in" compared to the recent fear of being "out." A subsequent rally out of these two scenarios would be fueled by investors chasing strength as even in bear market rallies (1938-1939) there is typically more than one leg higher. By contrast, a continued rally would expose the markets to getting overbought once again and would likely serve to threaten equities in late fall/early winter.

Monday, June 22, 2009

Hedge funds bet on Lehman debt

Top hedge funds have been buying up Lehman Brothers’ debt in hopes that the failed investment bank’s estate can win court battles to recover billions of dollars in collateral held by competitors with whom it did business. The bulk of the potential claims stems from JPMorgan Chase’s role as a clearing bank for Lehman in the repurchase – or repo – markets. Lehman borrowed heavily in the repo markets – a practice that left it susceptible to a loss of confidence.

Friday, June 19, 2009

Study looks at differences between institutional and retail mutual funds

Long-only equity strategies may have recouped most of their 2009 YTD losses, but there is little question the past year has left them with a volatility only their mothers could love. The FT reports this week that UK pensions are “paying the price for an equity bias”. Reports the paper:

“…UK company pension schemes are among the most heavily invested in equities when compared with employers based elsewhere. The average allocation to equities was 48 per cent at the end of 2008 - a figure that reflects the collapse in stock markets - and is higher than that in any other country where the private sector accounts for a significant proportion of pension schemes.”

At the same time, Hedge Funds Review points to a survey showing that pensions continue to allocate to equities. Reports the magazine:

“On the issue of active management, 27% said their allocations to active management would be reduced. A further 37% said they would increase their allocations but only if fee terms rewarded actual, not expected, out performance.”

Meanwhile, Pensions & Investments reports that European pensions are actually giving a “cold shoulder” to equities…

“In Germany…where de facto regulations have forced institutional investors to keep very low levels of investment risk, equity exposures have fallen to new lows…In the U.K., equity allocations have fallen steadily since 2003 to 54% of total assets as of Dec. 31, down from 68%…”

Against this backdrop, the Spring edition of the Journal of Investing contains an interesting article by Kent Baker of The American University, John Haslem of the University of Maryland and David Smith of the State University of New York at Albany called “Performance and Characteristics of Actively Managed Institutional Equity Mutual Funds” (available here).

Retail mutual funds are a roughly $10 trillion business in the United States alone. By comparison, institutional mutual funds manage only about $1.3 trillion according to the authors. (Most US institutions opt for separately managed mandates rather than pooled funds for their allocations.)

The authors examine fees and alpha to determine the value added by these funds. But instead of simply using the posted fees for each fund, they use the “active alpha” expense ratio measure developed by Smith’s SUNY Albany colleague Ross Miller (see must-read paper on this topic).

We have written about Miller’s metric several times. Essentially, it measures the fee paid per unit of active management - ostensibly what an investor us actually paying for (vs. the passive component of returns).

When applied to institutional mutual funds, this technique yields similar findings to those of retail mutual funds - fees per unit of active management are multiples higher than posted fees. We created the chart below from Exhibit 2 in the article to show you what we mean:

As expected, the high correlation between most institutional mutual funds and equity markets means that the fee attributable to active management is actually many times higher than the listed rate. This is about the same as a hedge fund with a 1.5% management fee and a 20% performance fee in a year when the total fund return is 10%. Only the hedge fund fee would drop to 1.5% if the return was 0% while the fee for the mutual fund, of course, remains at the same level.

In any event, the authors also find that larger funds outperform smaller ones - and not just because they enjoy economies of scale. Instead, they suggest that larger funds have more institutional investor oversight. Smaller institutional funds, by contrast are “offered primarily to trust accounts and through for-fee financial advisors.”

Finally, and somewhat counter-intuitively, Baker, Haslem and Smith find that large cash balances are associated with higher returns among institutional mutual funds. The causation remains in question, however, as they propose two hypotheses for this: 1) higher cash balances reduce trading friction surrounding asset inflows and outflows, or 2) better returns leads to more inflows and more uninvested cash.

Unfortunately, the bottom line is that institutional mutual funds as a group, fall victim to the same problems as retail mutual funds. As the authors conclude:

“Consistent with previous studies involving actively managed retail equity mutual funds, we find strong evidence that the average actively managed institutional equity mutual fund cannot beat a representative benchmark after expenses.”

Revisiting the debate over Yale's investing guru, David Swensen

Back in mid-March, I came across a link to an interview with David Swensen, chief investment officer for Yale University’s endowment and author of the 2005 book Unconventional Success: A Fundamental Approach to Personal Investment. Swensen has a phenomenal record running the Yale endowment and pioneered the use of hedge funds, private equity and a wide array of other alternative investments among institutional investors.

But his book offers a very different approach for individuals, who don’t have access to most of the investment managers used by Yale. Instead, Swensen recommended that individuals allocate their assets across a simple and fixed mix of six index funds (30% in U.S. stocks, 20% in real estate, 15% in U.S. Treasury bonds, 15% in U.S. Treasury Inflation Protected Securities, 15% in foreign, developed stocks and 5% emerging market stocks). Beyond occasional rebalancing, Swensen’s formula was fixed, unchanging and perfect for all. It seemed like the magic formula for investing success, according to Swensen.

One particular out-to-lunch passage struck me from the March interview, when Swensen asserted that someone following his magic formula “probably did reasonably well” through the recent credit crunch and market turmoil. That wasn’t true. The magic formula lost fully one-third of its value over the prior year, nearly as bad as the loss of the S&P 500 by itself and certainly not what people following Swensen’s advice (or reading his quote in the interview) would have expected. And so I posted my critique here.

The post has received a number of comments, most quite critical of my analysis. I posted a reply in the comments field today but I thought it was worth expanding my reply into a full-blown blog post to further the discussion.

[UPDATE: I asked Swensen if he would comment. He sent a reply that he did not want published. Needless to say, he doesn’t agree with me.]

First, I think it’s important to acknowledge that there's a huge (and misleading) disconnect between how Swensen ran the Yale endowment to produce such amazing results and the magic formula he recommended for ordinary investors. Yale uses active managers, has nothing like 30% of its assets in US stocks (or any such fixed asset allocations at all) and relies on a wide array of alternative assets, many of which aren't easily accessed by individuals. Plenty of investors turned on by Yale's results looked to Swensen for advice but the advice they received has no connection to the endowment's superior results. Those commenters who cite Swensen's Yale track record as evidence that his magic formula is a good idea have fallen into the same trap. “Swensen Fan,” for example, quotes Swensen mixing Yale’s results and the book’s formula.

Until he wrote a book for individual investors, Swensen regularly admitted that individual investors could not follow Yale's investing program. I suspect he got tired of giving that non-answer and, to paraphrase Woody Allen in the great flick "Manhattan," let's face it, he wanted to sell some books here. And there’s really not much offered to support the magic formula’s particular allocations beyond considerations of how those kinds of assets have performed in the past.

Second, commenters like “MSS,” “Stu” and “Finn” say one year is too short a time frame to evaluate how the magic formula has done. “Ignorance Arbitrage” says it’s singularly idiotic. But the point isn’t to assess Swensen’s formula over one-year periods. Swensen himself had misstated the performance of the recent formula (without even getting into how long it would take to earn back a 32% loss). It’s critical to assess how an investment strategy performs in all kinds of markets. Swensen’s seemingly conservative strategy worked fine under “normal” market conditions but failed miserably in the bear market. We’ve also just experienced a 30-year or so trend of declining long-term interest rates and inflation in the U.S. that gave a nice tailwind to certain assets. An asset mix constructed based on returns and volatility during that period might not work so well if the next 30 years see a very different interest rate backdrop.

[UPDATE 6/18/09: Running the results of the six-fund magic formula over longer periods doesn't help Swensen's case much. If you invested $10,000 in the magic formula at the beginning of 2005, when the book came out, how much would you have 4-1/2 years later on May 31, 2009 with annual rebalancing? $10,275. That's worse than if you'd kept the whole sum in T-bills or a money market fund and virtually identical to the $10,268 you'd have investing a BENCHMARK EXAMPLE of 70% U.S. Stocks and 30% U.S. Treasuries.]

Third, commenters Lawrence Weinman and “Finn” criticize asset allocations I supposedly recommended in the post. I didn’t actually recommend any strategy, offering the performance of a simpler mix for context. We do write about that topic frequently in Businessweek and on the blog, though. Check out this post about Mebane Faber or this one looking at age-appropriate portfolio designs, for a few examples. And I recently wrote a magazine article looking at the pro’s and con’s of asset allocation funds. There are also many great blogs that cover the subject like CXO Advisory, Bespoke Investment Group and Interlake Capital.

Finally, commenter "Finn" make reference to modern portfolio theory, the efficient frontier and the benefits of diversification. These are excellent theories but they're constructed on top of numerous simplifying assumptions about how the world works. I'd suggest taking a look at some of the more recent research about how MPT has failed of late. Particularly, see what Nassim Nicholas Taleb has said. Here's a quote from a recent interview with Taleb (free registration required):

The field of statistics is based on something called the law of large numbers: as you increase your sample size, no single observation is going to hurt you. Sometimes that works. But the rules are based on classes of distribution that don’t always hold in our world.

All statistics come from games. But our world doesn’t resemble games. We don’t have dice that can deliver. Instead of dice with one through six, the real world can have one through five—and then a trillion. The real world can do that. In the 1920s, the German mark went from three marks to a dollar to three trillion to a dollar in no time.

That’s why portfolio theory simply doesn’t work. It uses metrics like variance to describe risk, while most real risk comes from a single observation, so variance is a volatility that doesn’t really describe the risk. It’s very foolish to use variance.

The comments are open for further debate!

The Dollar and US Stocks

If it seems like the S&P 500 and the Dollar move in the opposite direction of each other on a daily basis, it's because they pretty much do. In fact, since daily pricing of the US Dollar begins in 1970, the six month correlation between the daily change of the two is at its most negative level ever. The next most negative level of correlation between US stocks and the dollar came in 1982. We can only hope, however, that our stocks and currency can perform like they did in the years following 1982.

Dollarstocks

Wednesday, June 17, 2009

CalPERS approves new asset allocation

US – CalPERS has increased its allocation to private equity and adopted a new cash bucket at an investment committee meeting yesterday.
document.write('
As previously reported, the board at the California Public Employees’ Retirement System increased its allocation to private equity to 14% from 10% and raised its cash target to 2% from zero. (Global Pensions, June 10, 2009)

The changes will mainly be funded from a reduction in global equity, which will drop to 49% from 56%.

The new allocation is meant to be an interim change until the board performs a long-term review of its investments next year.

Chair of the CalPERS investment committee George Diehr said: “This is not intended to be a long-range strategy but reflects our preference for higher liquidity and moderate risk, as well as the flexibility to respond to challenges and opportunities in the markets.

“Our investment officers will follow these guidelines as we position ourselves for short-term investment opportunities over the next year or so.”

What's Behind Soaring T-Bond Yields

Many market observers have been alarmed by the surge in long-term bond yields. This has also sparked a debate on Wall Street: Are the higher yields due to an emergent recovery or fears of higher inflation?

For now, I don't think it's either. More than higher bond yields, we're really seeing a closing of the gap between Treasury yields and corporate yields. In other word, investors are more willing to take on risk. To be even more precise, the level of risk-taking is backing off from its extremely scared level of about six months ago.

This chart shows the yield of the 30-year Treasury (red) along with an index of AAA bonds (blue).

fredgraph061709.png

Notice the closing of the gap between the two. Corporate yields are higher but the major change has come from Treasuries. This means that the price of risk is finally returning to normal.

Tuesday, June 16, 2009

Active Mutual-Fund Managers Beat S&P 500 by Most in 26 Years

Mutual-fund managers who pick stocks are beating the Standard & Poor’s 500 Index by the widest margin in 26 years by buying shares of midsize companies such as Sun Microsystems Inc. and Seagate Technology.

Active U.S. equity funds returned an average of 7 percent through May, compared with a gain of 3 percent for the index, a benchmark of the largest U.S. companies. The gap is the biggest since 1983, when funds beat the market by 4.3 percentage points in the first five months, according to Morningstar Inc.

“We’ve been through a period of extraordinary volatility, and that creates opportunities for managers to find mispricings,” said David Kelly, chief market strategist for New York-based JPMorgan Funds, a unit of JPMorgan Chase & Co. that oversees $438 billion.

The agreement last week by New York-based BlackRock Inc. to acquire Barclays Global Investors for a record $13.5 billion put renewed focus on the long-running debate over whether active or index funds produce better returns for investors. San Francisco- based BGI, the world’s biggest money manager, oversees $1.5 trillion, with more than 70 percent in accounts pegged to indexes, including exchange-traded funds.

Diversified U.S. equity index funds declined 38 percent in 2008, less than their active peers, which fell 39 percent. That helped persuade more investors to move to passive investing.

Investors withdrew about a net $230 billion from all U.S. stock and bond funds in 2008, while putting $34 billion into index mutual funds, according to the Investment Company Institute, a Washington-based trade group. Exchange-traded funds, which also follow indexes and trade throughout the day like stocks, added $177 billion through new sales.

Mid-Cap Stocks

Jeff Tjornehoj, a Denver-based senior research analyst at Lipper, said active managers benefited this year from holdings of mid-capitalization companies, those with market values from $3.5 billion to $9 billion.

Tjornehoj said active funds hold a smaller proportion of the largest 100 companies, as measured by market value, than represented in the S&P 500 and a greater amount of the bottom 300. Every company in the lower 300 has a market value of less than $9.8 billion, said Howard Silverblatt, senior index analyst at Standard & Poor’s in New York.

Stocks in the bottom 60 percent of the index rose 12 percent through June 7, Lipper found. Stocks in the top 20 percent lost 4.79 percent.

Sun Micro, the Santa Clara, California-based software maker that agreed in April to be acquired by Oracle Corp., more than doubled in that period. Cayman Islands-based Seagate, the world’s largest maker of hard-disk drives, rose 99 percent.

More Tech

Active managers own more technology stocks and fewer utility shares than represented by the S&P 500, Tjornehoj said. Information technology stocks rose 19 percent through May, making them the best-performing group in the market benchmark, Bloomberg data show. Utilities lost 8.74 percent, the worst performance among the 10 industry groups in the index.

John Schonberg, lead portfolio manager of the $592 million RiverSource Mid Cap Growth Fund, rode technology to a 39 percent gain this year, tops among mid-cap growth funds, according to Chicago-based Morningstar.

“Last year, a lot of tech stocks were selling at extremes we haven’t seen since the tech bubble crashed,” Schonberg said in a telephone interview from Minneapolis.

Schonberg’s fund had 34 percent of its assets in software and hardware stocks at the end of March, according to Morningstar. The fund’s largest holdings include Tibco Software Inc., a Palo Alto, California software firm, PMC-Sierra Inc., a Santa California, maker of semiconductors, and Ciena Corp., a Linthicum, Maryland, producer of gear for communications.

Michael Marzolf, a portfolio manager on the fund, said mid- cap stocks have gained with signs of recovery in financial markets. The S&P 400 Mid-Cap Index rose 11 percent this year through June 12, while the S&P 500 Index rose 4.8 percent.

“When fear is increasing, people move up the capitalization scale,” he said. “When fear wanes, people will move down the scale and take more risk.”

Don't Count on TIPS

Their inflation protection will likely be overwhelmed by their vulnerability to rising interest rates.

Treasury inflation-protected securities may rank as today's most over-hyped investment product. To hear their proponents talk, TIPS will shelter you from the ravages of inflation, which does seem likely to worsen. But they forget to mention that TIPS are Treasury bonds, which are almost certain to fall in value as inflation heats up.

The problem is that inflation and interest rates often move almost in lock step. Take the worst-case scenario from recent history: As measured by the Consumer Price Index (CPI), inflation hit 13.6% in 1980, and yields on the ten-year Treasury peaked at 15.8% the following year.

TIPS protect you from inflation with one hand, but they punish you with interest-rate hikes with the other. Remember: In the strange world of bond math, when yields rise, bond prices fall. TIPS rise in value with expectations of increases in the CPI, the government's chief measure of inflation -- albeit one that's widely criticized as understating the true inflation rate. But at the same time, TIPS prices fall as the price of other Treasury bonds do.

If you buy TIPS directly from the Treasury and hold them to maturity, you'll receive the full CPI increase. If you invest through a regular mutual fund or an exchange-traded fund, you're at the mercy of the market's expectations for the CPI.

TIPS probably won't lose money when inflation heats up, but they're unlikely to make much, either. It's pure fantasy to think that putting 10% or 20% of your assets in TIPS will insulate your portfolio against inflation. If you want real inflation insurance, you'll almost certainly do better with commodities, which I'll discuss shortly.

TIPS are pricey

TIPS have advanced smartly over the past six months as fears of deflation have abated. Year-to-date through June 11, ten-year Treasury notes have lost 11%, while 30-year bonds have tumbled 28%. TIPS, meanwhile, have risen about 5%. That means that TIPS, which deliver a real, before-inflation-adjusted yield of 1.9% on maturities of ten or so years, are no longer cheap relative to Treasuries, says Ken Volpert, head of taxable bonds at Vanguard. "TIPS are a lot richer than they were six months ago," he says. "I wouldn't sell them, but I don't think I'd buy them here." (I wrote a bullish piece on TIPS in January.)

Dan Shackelford, manager of T. Rowe Price New Income (symbol PRCIX), a taxable-bond fund, is even less optimistic. TIPS account for just 1.5% of the fund. "TIPS are a subset of the Treasury market," he cautions.

Consider the inner workings of one of the best TIPS funds, Vanguard Inflation-Protected Securities (VIPSX). The fund, a member of the Kiplinger 25, sports an average maturity of nine years and yields 1.5%. That's the return you can expect before inflation adjustments.

But if interest rates on Treasuries maturing in nine years were to rise by one percentage point over the course of the next year, the fund's price would drop by about 5.9%. If rates increased by two percentage points, the price would fall by 11.8%.

In the meantime, of course, you'd get the inflation adjustment. So suppose the CPI rises from zero to 3% over the next year, but interest rates also rise by one percentage point. You'd start with that 1.5% real yield and gain 3% from the inflation adjustment, but lose 5.9% because of the rise in yields. In sum, you'd be facing a loss of a bit more than 1%.

Don't get me wrong. Compared with regular Treasury bonds, TIPS are a no-brainer. Treasuries make little sense in today's market given Uncle Sam's growing borrowing needs. Unless you foresee a return to the near-Armageddon-like conditions of last fall and winter, with widespread concerns about deflation and defaults, buying a straight Treasury bond yielding less than 4% doesn't make sense.

Most bonds other than Treasuries have rallied sharply along with stocks since early March, but bond-land still offers better opportunities. You can get a 3.4% tax-exempt yield on Vanguard Intermediate-Term Tax-Exempt fund (VWITX) or a 5.6% taxable yield on Vanguard Intermediate-Term Investment Grade fund (VFICX), which invests in corporate bonds. The muni fund will lose about 6% in price if rates on munis with similar maturities rise one percentage point; the corporate fund will lose about 5%.

Where should you look for real inflation protection? I think you have to look at more-aggressive investments. The prices of oil and other commodities are likely to far outstrip overall inflation. Indeed, rising commodity prices as the economy begins to show signs of life may be the biggest driver of inflation. Consider a fund such as T. Rowe Price New Era (PRNEX), which invests in stocks of oil-and-gas companies, as well as a wide range of other commodities, including metals and fertilizer. Putting 5% to 10% of your stock money in a fund like this may serve you well as inflation heats up.

The nightmare scenario for many investors is that the flood of new Treasury obligations will cause interest rates to soar and the dollar to plunge. I don't think that's likely. But if it happens, TIPS won't save your investments from capsizing. A commodities fund, however, could be a life preserver.

Greenwich: How US institutions are recalibrating strategies

The main conclusions of a new report by Greenwich Associates on how US institutions have responded to the global downturn are hardly surprising - that big US institutions used the the first half of 2009 to re-examine their investment policies, asset allocations and investment managers to determine what went wrong last year; pinpoint the policies, investments and managers that performed as expected through the market crisis; and to identify those that fell short.

Nevertheless the report, based on what seems to be a fairly exhaustive survey of 152 US institutions, identifies some trends worth noting for the year ahead.

The lessons that these institutions drew from their internal reviews will have a “profound impact, not just on the US investment management industry, but also on the world’s financial markets and on the millions of American workers who rely on the nation’s pension system for their security in retirement”, predicts Greenwich.

Of the 162 respondents, 97 were corporate pension funds, 34 public funds, and 21 endowments and foundations with at least $1bn of assets under management.

The key findings of the survey:

  • Institutions are sticking with diversification strategies: they continued to reduce allocations to US equities through the second half of 2008 and into the first six months of 2009, and remain committed to significant allocations of hedge funds, private equity and other alternative investments.
  • At the same time, corporate plan sponsors hit last year by plunging portfolio asset values are moving to reduce the volatility of pension fund investment performance by increasing allocations to fixed income, even as they shut defined benefit plans to new employees and reduce matching contributions to defined contribution plans.
  • The financial crisis has had an equally profound effect on public pension funds. As public funds are not subject to the same accounting rules that govern corporate pensions, they are accepting greater levels of short-term volatility and lower levels of liquidity in return for the chance to make up for last year’s setbacks with strong investment returns. As such, fewer public funds are shifting assets into fixed income and more are increasing allocations to alternative asset classes with higher potential for returns.
  • After finding themselves forced to sell assets into a falling market in order to fund operations and other needs during the crisis, endowments and foundations are revising their views on cash holdings and increasing liquidity requirements within their portfolios. But there are no indications they are reconsidering investment policies that now emphasise diversification and incorporate relatively high allocations to hedge funds, private equity and other alternative asset classes. In fact, 44 per cent of endowments and foundations have actually increased their allocations to hedge funds over the past 12 months.
  • Public pension funds and endowments have been the first movers among US institutions to make opportunistic investments related to the market crisis. Almost a quarter of US institutions overall have already made investments in opportunistic funds, including vehicles looking to exploit rare opportunities in fixed income, secondary private equity and other asset classes. Endowments and foundations have led the way, with 45 per cent of them investing in opportunistic funds, followed by public pension funds at roughly one-third.
  • More than 20 per cent of US institutions have shifted assets from active managers to passive strategies in the past year, but it is not yet clear whether this move represents a temporary “parking” of assets as institutions abandon underperforming active strategies and managers, or a more secular change in approach.
  • Almost half of US institutions have scaled back their securities lending programmes after discovering unexpected levels of risk during the market dislocations of last year.
  • Manager turnover could reach historic highs over the course of the next 12 months if institutions follow through on their plans for managing hiring and firing. At the very least, managers can expect tough new demands for increased transparency and disclosure.

Hedge Fund Leverage

Monday, June 15, 2009

The Outlook is Not Up, But Very Widely Sideways


John P. Hussman, Ph.D.

Valuation Update: We estimate that the S&P 500 is currently priced to deliver total returns over the next decade in the range of 6.5-9.0%, centered at an expected total return of about 7.8% annually. Stocks are modestly overvalued here, except on metrics that assume a permanent recovery to 2007's record profit margins (which were about 50% above the historical norm).

On normalized profit margins, sustainable S&P 500 earnings are slightly above $60 on the index. That's certainly higher than the 7 bucks of net earnings that companies in the index have reported over the past 52 weeks, but unfortunately, even at current prices, the S&P 500 is near 16 times normalized earnings.

You can get that basic figure a lot of ways. Currently, book value on the S&P 500 is slightly above $500. Outside of the past 15 years, when the economy was building up to a debt crisis, the typical return on equity for the S&P 500 has historically ranged between about 10-12%. While a higher debt load raises return on equity in good times, it also leads more quickly to bankruptcy in bad times, as we've observed, and will continue to observe. The deleveraging pressure on the U.S. and global economy here is likely to be associated with a normalization in return-on-equity just as we're observing a normalization in profit margins (return on revenue, so to speak). Applying the higher end of historical return on equity to current book value, and assuming that we don't see major further writedowns in book value for the index, we again get a normalized earnings figure close to about $60. The higher earnings figures (over $80) that we observed in 2007 were based on profit margins and returns on equity far above the historical norm, and were also bolstered by unusual contributions from financials and commodity-driven companies.

Presently, the price-to-book ratio on the S&P 500 is about 1.9. If you think about the 1974 and 1982 lows, we observed price/book ratios at about 0.8, while price-to-normalized earnings multiples were at about 7. So the S&P 500 would have to drop by about 60% to match the best valuations that we've seen during the past 40 years. Investors shouldn't kid themselves that stocks are cheap – in the sense of being priced to deliver outstanding long-term returns – just because we've observed a wicked decline. We're not even close.

At the March lows, the S&P 500 was priced to deliver long-term returns in the 10-12% range. Certainly not bad, but only modestly above the norm on a historical basis, in an economy that faced (and still threatens to suffer) difficulties well outside the norm. While that might have been the final low, and we can't rule out further market gains, I still believe that it is a mistake to rule out eventual “revulsion.” I don't think that we need to match valuations that existed at the 1974 or 1982 lows, but at a multiple of 16 times our current estimate for normalized earnings, suffice it to say that the market is not cheap.

What we've seen in recent weeks has been a recovery of between 25-33% of the losses that the market has suffered since its 2007 peak, putting the S&P 500 up about 6% year-to-date in total return, with the Dow up about 2%. While that sort of recovery, in this event, has implied a significant gain given the extent of the prior losses, the rebound relative to the loss is not unusual (though not easily predictable either, since such rebounds can abruptly fail early or late into the bounce). I continue to believe that it is a mistake to treat the recent advance as if it has significant information content about the economy. We are observing only smaller negatives (and even those may only be a reprieve based on a temporary lull in the mortgage reset schedule).

Until now, “less bad than expected” has been enough for investors. As a friend of mine quoted last week from a song by The Doors, “I've been down for so long, it feels like up to me.” At this point, however, stocks are priced to require an economic recovery. That is a difficult bet, in my view, because as I noted last week, economic expansions are emphatically not driven by a “consumer recovery.” They are invariably driven by swings in gross domestic investment – capital spending, autos, housing, factories, and other outlays that are heavily reliant on debt financing. That's why housing starts have such a strong correlation with GDP growth.

It is a very hard sell to expect a sustained recovery in debt-financed gross investment in an economy under strong deleveraging pressure. That's particularly true since the U.S. itself has not financed a penny of the growth in U.S. gross domestic investment in more than a decade – all of the growth has been financed by foreign capital inflows via a massive current account deficit. With government spending now drawing on those foreign savings to defend bank bondholders from losses, and a continuing need to shrink the current account deficit in the years ahead, gross domestic investment is likely to continue to be squeezed. We are in the midst of – and will continue to require – perhaps the largest adjustment in U.S. personal, corporate and government balance sheets that we will see in our lifetimes. This will be a very long slog. The outlook is not up, but very widely sideways.

It's nice to see consumer confidence rebound from its abysmal lows, but consumer confidence can largely be predicted from past changes in the stock market and inflation. A nice rally in stocks, coupled with soft inflation figures, has been helpful. But consumer confidence is not a useful predictive indicator of even consumer spending. Consumption is a very large, but also very stable part of GDP, and it is not the source of major variance. Indeed, except during the past year, we've never seen nominal consumer spending decline year-over-year even in recessions. The “permanent income hypothesis” of Modigliani and Friedman holds up very well in the data – investors simply do not significantly shift their consumption based on short-term fluctuations in income.

That said, it's a very negative signal that we've observed a decline in consumer spending over the past year – again – it's never happened before. The fact that it has in this instance suggests that consumers are anticipating a largely permanent downward adjustment in their overall spending ability. The lack of opportunity for continued mortgage equity withdrawals (a major source of consumer spending in recent years) explains part of that. The loss of investment and home values is another.

In typical recessions, unemployment tends to be a lagging indicator, and the employment figures themselves tend to move up and down roughly in concert with the overall economy. In the current downturn, however, the unusually high debt burden and precariousness of mortgages among households creates a dynamic that we don't usually observe. In the current cycle, as Ray Dalio of Bridgewater has correctly (in my view) pointed out, unemployment is likely to be a leading indicator of the economy. In an overleveraged economy, job losses can be expected to be followed by further delinquencies and mortgage foreclosures. While I don't expect that this will cause a violent feedback loop, I do believe that it is glib to assume that the employment markets and the U.S. economy are on a one-way track to improvement.

We've seen a nice but predictably temporary lull in the mortgage reset schedule. We've seen a nice, typical recovery of just under a third of the market's prior losses. We've seen a nice easing from the frantic pace of job losses earlier this year. All of those have been pleasant, but it is a mistake to draw information from them. There is very little information content in mean reversion following extreme moves.

Cash, Liquidity, and New Stock Issuance

I continue to be astounded by the bad analysis, misleading reporting and non-equilibrium thinking in the discussion of the bailouts, new stock issuance by financial companies, and other forms of “liquidity.” This seems like a good time to review some concepts relating to “money flow” and equilibrium in order to clarify what is going on here. The upshot is that there is not a bunch of new money “looking for a home.” Rather, we've observed a reallocation of risks from the private sector to the government, with the amount of purchasing power in the economy unchanged.

First, note that when the government issues Treasuries to finance the bailout of financial companies, somebody has to buy the Treasuries. The Treasury's spending is not “new” money, but is instead a redistribution. Think about it (drawing it out with pen and paper can help). In aggregate, if the government issues a trillion dollars of Treasury debt to finance bailouts, a trillion dollars of cash is taken out of the hands of the buyers of those Treasuries, and a trillion dollars of cash goes into the hands of the banks, who issue some sort of obligation (mostly preferred stock) to the government in return. So on the government's balance sheet, it has a trillion dollars of new debt as a liability, and a trillion dollars of bank stock (which may very well become worthless down the road, but is booked as an asset initially). On the private sector's balance sheet, there is a new trillion dollar asset (the Treasury bonds), and a new trillion dollar liability (the securities issued by the banks to the government). There has been a reallocation of risk, but emphatically, there is no more cash than there was before. All that is happened is that the holders of cash may have changed.

I say “may” have changed, because at present, the largest purchasers of Treasury securities have been financial companies. In effect, no net cash has been spent or received. If you add all the transactions up, the cash nets out, leaving us with a pure asset swap. The banks have a bunch of new Treasury securities on their books, and they have issued a bunch of preferred stock to the government to pay for it. They can't do any lending with that until they get somebody else to buy the Treasuries in return for cash that already exists.

Contrast this situation with what the Fed has done. The Fed has gone out and purchased commercial mortgage-backed securities from the banks, and has given them cash (in the form of bank reserves). On the Fed's balance sheet, there are new assets – the mortgage securities – and new liabilities – the cash (which is an obligation of the Fed, as is written right there at the top of the pieces of paper in your wallet). The mortgage payments previously owed to banks are now owed to the Fed, who holds those mortgage securities. Imagine the Fed holds those securities permanently, and all the mortgages are in fact paid off. Then the assets on the Fed's books (those mortgage securities) would decline as the securities are retired, and the Fed's liabilities (U.S. currency) would also decline – assuming that the Fed holds onto the payments and takes the dollars out of circulation. In actuality, these transactions are not permanent, but are repos, so banks aren't counting on that cash being actually useable for new long-term loans - they are using it as stopgap liquidity. Meanwhile however, there is a significant risk to having such a large volume of government liabilities outstanding, because it may very well cause a deterioration in the value of those liabilities over time (i.e. inflation).

On the bank balance sheets, there are fewer mortgage securities as a result of the Fed's intervention, but more cash reserves in their place. If the banks were willing to take the risk to lend this cash out, and there were borrowers with economic projects that they thought were promising enough to borrow money on the obligation of paying it back, we would get new lending and new economic projects. That is not happening, because the banks were overleveraged to begin with, and are using the cash as a cushion against further losses. Private borrowers are also generally averse to new debt and are trying to deleverage. So for now, we have very little inflationary pressure, but also very little new lending, as a result of Fed interventions.

Aside from inflation risks over the medium term (say 4-10 years out), the government's intervention will ultimately be costly to the extent that the securities it has taken from the private sector (bank equity in the case of the Treasury, commercial mortgage-backed securities in the case of the Fed) turn out to be worthless. In my view, this is a significant risk that has been understated by both the Fed and the Treasury. Time will tell.

In recent weeks, we've observed an enormous amount of new stock issuance, rivaling only the spikes that we observed at the market peaks of 2000 and 2007. Financial companies in particular are using the funds received from private investors to pay back the Treasury. Again, think in terms of balance sheets. On the bank's ledger, there is new stock being issued to private investors in return for cash. That cash then goes to the Treasury, and the stock that was issued to the Treasury is retired. In the end, there is no more cash at the banks than there was before, but instead of the Treasury owning stock, new private investors own it. From the Treasury's perspective, it now has less bank stock, but a return of the cash. The Treasury could retire the debt it incurred, but is currently fighting to hold onto that cash for further bailouts at its discretion.

My difficulty with the recent wave of issuance is that it has largely been based on misleading disclosures, not least being the government's “stress tests” that I've discussed previously. To issue stock on such assurances is like issuing stock on the basis of a fraudulent offering document. Yes, it is a free market, and investors can buy newly issued stock if they like, but my impression is that investors buying this newly issued stock have been misled about the health of the underlying institutions.

Overall then, the proper way to think of all of these bailouts and stock issues is not that new purchasing power is being created, but that ownership of existing assets and liabilities has changed in a way that reallocates risk from the private sector to the government. There is not a bunch of money "looking for a home." The overall effect of the bailouts has been to put Treasury securities and temporary bank reserves in the hands of the financial companies, in return for preferred stock and temporary repos of commercial mortgage backed securities. Let those corporate securities fail however, and that's when we have a real money creation problem, because the government will have created liabilities that it cannot buy back in using the assets it took in when it created them. That's a huge risk here.

Meanwhile, apart from the new issuance discussed above (which has, in effect, swapped bank stock out of the hands of the Treasury and into the hands of private investors), I am perplexed that people who hold themselves out as investment professionals continue to talk about “money going into stocks” as if the dollar that a buyer brings into the market doesn't go right back out in the hands of the seller.

As I noted in the March 12, 2007 comment (The Money Flow Myth and the Liquidity Trap),

“We should be very clear that there is no such thing as money going into or out of a secondary market. When stocks are issued in an IPO, or bonds are floated to investors, companies receive funds from investors and, in return, give investors pieces of paper called stocks and bonds, as evidence of the investors' claim on some future stream of cash. This is a “primary market” transaction.

“Once those pieces of paper are issued, they are traded between investors in the “secondary market.” When we talk about the stock market, we're talking almost exclusively about the secondary market, because new issues make up a very small part of total activity.

“Dear Wall Street analysts and financial reporters – when investors purchase a stock in the secondary market, the dollars that buyers bring “into” the market are immediately taken “out of” the market in the hands of the sellers. It is an exchange. This is why the place it happens is called a “stock exchange.” The stock market is not an air balloon into which money goes in or out and expands or contracts that balloon. Nor is it a water balloon that is expanded by pouring in “liquidity.” Prices are not driven by the amount of money that buyers “put in” or sellers “take out” (as those dollar amounts are identical). Prices are determined by the relative eagerness of the buyer versus the seller.

“If a dentist in Poughkeepsie is willing to pay up 10 cents to buy a single share of General Electric, the total market value of General Electric increases by over $1 billion (GE has 10.28 billion shares outstanding - do the math). In this way, market capitalization can be created and destroyed out of thin air and on the smallest of trading volumes. So you'd better be sure that the there is a sound and fairly reliable stream of expected cash flows backing up the value of the securities you're buying.

“Cash does not ever find a “home” in a secondary market. Every time you hear the phrase “investors are putting money into…” or “investors are taking money out of …” or “money is flowing out of … and into …,” it is a signal that the speaker is unable to distinguish a secondary market from a primary one.

“As I used to teach my students, if Mickey sells his money market fund to buy stocks from Ricky, the money market fund has to sell some of its T-bills or commercial paper to Nicky, whose cash goes to Mickey, who uses the cash to buy stocks from Ricky. In the end, the cash that was held by Nicky is now held by Ricky, the money market securities that were held by Mickey are now held by Nicky, and the stock that was held by Ricky is now held by Mickey. There may have been some change in the relative prices between cash, money market securities and stocks, depending on which of the three was most eager, but there is precisely the same amount of “cash on the sidelines” after that set of transactions as there was before it.

“I'm similarly convinced that Wall Street has no idea what it's talking about when it uses the word “liquidity.” While using the phrase “global liquidity” lends a further element of worldly sophistication, Wall Street still hasn't the slightest idea what it's talking about. The phenomenon that's being called “liquidity” is nothing more than a combination of fiscal irresponsibility and risk blindness, and will ultimately prove itself to be the time-bomb that it is when investors begin to “re-price” that risk.

All of that is as true now as it was at the time in 2007, when the S&P 500 was above 1400. Investors hoping to ride a “wave of liquidity” may eventually discover that the wave leads to a plunge over the falls.

Market Climate

As of last week, the Market Climate for stocks was characterized by modest overvaluation, with stocks priced to deliver somewhat sub-par long-term returns, and mixed market action – with breadth the most favorable, and interest rate behavior the most unfavorable within that set of measures. The Strategic Growth Fund is fully hedged here, not because we are forecasting steep market losses (though we would not rule them out) but because the average return-to-risk profile of stocks has not historically been adequate under similar conditions. Moreover, if anything, economic fundamentals are far worse than other periods where we've observed similar valuations and market action, which strongly suggests that investors have gotten well ahead of themselves. On an individual stock basis, we also don't observe broad undervaluation. There are certainly pockets of what I view as strong values, which are where we've focused our individual stock selections, but the overall market is not cheap on an aggregate basis or on the basis of stock-by-stock analysis. The idea that stocks are attractive on a valuation basis is an illusion borne of the depth of the decline they suffered after being steeply overvalued, not a reality based on prices being currently reasonable in relation to the likely stream of cash flows from the underlying companies.

There have been, and there will be, better valuations and better market action on which to base significant risk taking in expectation of sustainable long-term returns. On a historical basis, current conditions would be mediocre even in a normal economy, and again, in the context of current economic fundamentals, they are a speculation – because even their mediocrity relies on economic fundamentals normalizing. I don't trust that proposition.

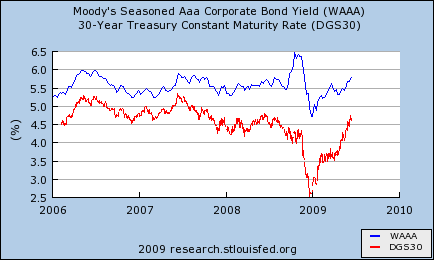
In bonds, yields have shot up on the combination of supply concerns, hopes of a quick return to economic growth, and to some extent, concerns about eventual inflation pressures. While I have expressed significant concerns about those eventual inflation pressures, my impression is that the depth of the selloff in Treasuries has removed the extreme risk that we saw in late December, when I wrote “Given the level of extension in yields, it would not be difficult for the bond market to generate losses of say 10% in the 10-year Treasury bond, and as much as 20-25% in the 30-year Treasury bond over a very short period of time.” Presently, yields are somewhat higher than is consistent with probable nominal GDP growth here, and such deviations don't tend to persist for long. As yields shot higher last week, we extended our durations modestly in the Strategic Total Return Fund, to an average duration of just over 3 years, mostly in TIPS, but with some straight Treasuries to assist that extension (since TIPS tend to have muted durations). I expect that we'll modestly scale to higher durations if yields press significantly higher, but at present, our durations continue to be well below “market” durations, so our position is still conservative overall. The Fund also currently has about 20% of assets allocated to precious metals shares, foreign currencies, and utility shares.

What's Wrong With ETFs

Written by Matthew Hougan
Monday, 15 June 2009 10:45 | Related ETFs: USO

The crescendo of concern surrounding ETFs continues to grow, and something must be done.

It’s rare that I open my email box these days and don’t find some rant from an investor about how they’ve been ripped off by this or that ETF. Usually, it involves one of the leveraged or inverse ETFs, which failed to provide the long-term returns the investor expected.

I usually point readers to our recent webinar on leveraged and inverse ETFs, and explain briefly how compounding works. I remind them that these products are by and large working as designed, and gently suggest that it is the investor’s responsibility to understand how the products work before buying them.

More recently, I’ve been getting an earful about commodity ETFs, particularly USO, the United States Oil Fund (NYSE Arca: USO). The concerns stem from a simple fact: While spot crude rose 49% year-to-date through June 1, USO was up just 13%. That 36% disconnect has a lot of people upset.

For these readers, I walk through the basics of contango and backwardation, and explain that crude oil futures are a different animal from spot crude. I point to a few basic primers on the difference between spot prices and futures prices, such as this one from HardAssetsInvestor.com.

Still, many of the readers think something nefarious is going on. Consider this post from “arizona" on our discussion boards:

“I bought both USO and USL near their lows and I'm quite frustrated at what sure seems like these products are not even close to mimicking the performance of the spot price of oil which, as of this morning, sits above $71/barrel.

I understand that these products track the price of futures and I've heard the whole contango story but it's my understanding that contango has unwound and these products are closer to their true price and are actually closer to backwardation now. Is this accurate?

I'd love to see a chart which overlays the spot price, the futures price and the prices of both USO and USL”

Well arizona, here you go. I’ve only used USO and not USL so that we could have the longest possible data range, going back to August 2006.

IU_All_Oil_Not_Equal

The red line is USO. The green line represents the S&P GSCI Crude Oil Total Return Index, a simple rolling position in crude oil futures. The blue line is spot oil.

A glance at the chart will tell you everything you need to know. USO has tracked its benchmark very well, but has lagged crude oil dramatically. That’s particularly the case since December 2008, when a massive contango opened up in the oil markets and caused a huge deviation between USO and spot crude.


As for the second part of arizona’s question, yes, contango has largely disappeared from the market since this spring. And true to form, USO has come closer to tracking spot oil. From April 1 to June 1, USO traded up 31%; over the same time period, crude oil rose 30.4%.

The problem is that if you bought in way back in December, those early losses are still haunting you.

Morningstar recently issued a statement calling for ETFs like USO and leveraged/inverse products to be regulated as derivatives. It said that individual investors who buy these products should be treated like investors who purchase options. Before you can buy or sell options from a brokerage account, you must agree that you’ve read a lengthy paper on how options work.

Similarly, Morningstar called for a revamping of the educational and licensing requirements of financial advisers to include coverage of these unique ETFs and how they work. Too many advisers are using these as a “backdoor” to get leveraged, short and commodity exposure into client accounts, it said, and those advisers should have to demonstrate expertise before they buy and sell.

I think I agree.

ETFs are tremendously empowering because they deliver institutional-caliber exposure to all investors. But clearly, not all investors understand these products well enough to use them properly. Investors are having sour experiences and losing money. It’s making them question the value of even true-vanilla ETFs. Education and revamped licensing agreements could be a first step toward correcting this.

Later this week, industry legend John Bogle will be making a presentation to the Journal of Indexes editorial board where he will, among other things, discuss some of the problems with ETFs.

Prior to the presentation, IndexUniverse.com will be hosting a free dial-in webinar with Mr. Bogle (register here) where investors can call in and ask Mr. Bogle any question they want.

I won’t be in New York for the actual board meeting, but I will be dialing into the webinar, and the questions I want to ask are these: Do we need to regulate leveraged, inverse and commodity ETFs? Have ETFs opened up too much of the market for investors?

Here’s the thing: I’ve been doing this for two years now, and still the emails pour in. All the information people need is out there, but still the rants occur.

The problem is that the wave of new investors pouring into ETFs is growing every day. Working in this industry, it sometimes feels like ETFs are the center of the investing universe. After all, they are one of the fastest-growing financial products in the world, and they increasingly dominate trading volume on the national exchanges.

But the truth is that most investors are still unaware of ETFs. We’re probably in the third or fourth inning in terms of investor pickup. A lot of new investors are coming to the space every day, and they’re making the same old mistakes that other people made in these leveraged and inverse ETFs.

Barron's Roundtable Head Scratcher

This weekend's Barron's provided a mid-year update to its annual "Roundtable" report, and as the title of the article suggested, the consensus among panelists was that the market has come "too far, too fast." While that view is certainly not a minority opinion, we are confused with the logic behind it. As noted in the article,

"Many predicted at our Jan. 5 confab that the stock market, oversold and under-loved, was due for a major bounce. Now they think stock prices have overshot corporate fundamentals and a correction is in order."

So on January 5th, when the S&P 500 was at 927, the members of the Barron's Roundtable were looking for a major bounce. Now, with the S&P 500 up 2% since then, they think the market has come too far, too fast?

S&P 500 Barrons

Friday, June 12, 2009

The Market's P/E Ratio Surges

Here's a look at the S&P 500 (black line, left scale) and its earnings (gold line, right scale).

image820.png

The two axes are scaled at 16-to-1 so when the lines cross, the market's P/E Ratio is 16. I think we're at an interesting point where the stock market's P/E Ratio doesn't tell us much. The market has clearly sensed signs of recovery even though earnings are still plunging. As a result, the market's P/E Ratio has jumped about 50% since March.

Does this mean that stocks are valued 50% more favorably? Not at all. I think the market is getting a better sense of where earnings will bottom. Analysts currently see earnings reaching a trough of about $38 for the third quarter. I can't say if that's right but it does seem reasonable.

The fourth quarter of 2008 was awful so once we get that behind us, the trailing earnings picture will look much better. According to S&P, AIG took out over $5 all by itself. The current outlook is that the S&P 500 will earn $54 for 2009. That strikes me as high but not out of reach.

For 2010, Wall Street sees earnings of $73.56. At 16 times earnings, that means an S&P 500 at 1177 which is about 25% higher than we are now.

One other point to note: Analysts have not been very good at getting earnings right. In a few weeks we'll close the books on Q2. One year ago, Wall Street was expecting Q2 earnings of $26.73. Now they're expecting just $13.49.

High Yield Credit Spreads At Lowest Levels Since September

Spreads on high yield bonds continue to narrow, and at a level of 1,060 basis points (bps) above Treasuries, they are now at their lowest levels since late September according to Merrill Lynch's High Yield Master Index. As shown in the chart below, current levels are still 155 bps above where they were prior to the Lehman bankruptcy. So while many market indicators have worked off much of the panic that was caused by the Lehman, high yield spreads still have some work to do before reaching "pre-Lehman" levels.

High Yield Spreads060909

Peter L. Bernstein on risk

The celebrated author of Against the Gods: The Remarkable Story of Risk explores the history of risk and how it works in real-world markets and in our lives.

Risk doesn’t mean danger—it just means not knowing what the future holds. That insight resides at the core of risk management for companies, whether in managing the potential downside of an investment or putting a value on the option of waiting when making irreversible decisions. In this video Peter L. Bernstein also explains why in the real world the most sophisticated mathematical models can sometimes fail. For the video click here: http://www.mckinseyquarterly.com/Organization/Strategic_Organization/Peter_L_Bernstein_on_risk_2211

HF managed accounts may not be no-brainer. May require quarter - maybe half - a brain after all.


With the notable shenanigans perpetrated by some hedge fund managers, managed accounts seem like a no-brainer. After all, who wouldn’t want to be in full control of their own private hedge fund? You could redeem whenever you wanted, get real time position-level transparency and even do your own valuations.

But as we have suggested in the past, the situation is not quite this simple. Unfortunately, no managed account is an island. The legal separation of assets does not sever the fund’s destiny from those of other similar (especially parri passu) managed accounts and funds. If the managed accounts are not parri passu (for example, if each investor overlays their own risk management rules) then this problem would be solved. But it would open up another issue: each fund would be different and would have no appropriate track record.

This is one of the points raised in a slide deck being circulated by due diligence company SwissAnalytics. One of the slides in the presentation (available here at Barclayhedge’s website) contains the following helpful summary of the pros and cons of managed accounts:

But one of the best articles on this topic is probably Edhec’s 2005 paper subtitled “The Benefits and limitations of managed account platforms” although author Jean-RenĂ© Giraud stops short of using the term “disadvantages” - opting instead for the more innocuous “limitations”.

Managed accounts clearly addressed a number of issues…

But despite the fact that managed account platform provider Lyxor sponsored the paper, Giraud wrote:

“Managed accounts are often cited as the panacea when it comes to investor protection, but one should not overestimate the benefits of such platforms as the extent of the protection is highly dependent on the nature of the platform and the infrastructure supporting the trading activity.”

So what used to be a no-brainer may require, say, half a brain now in order to navigate some of the potential pitfalls.

Monday, June 08, 2009

THANK YOU, PETER

The world lost one of its foremost financial historians and analysts on Friday, when Peter L. Bernstein died in New York.

As an author, editor and investment strategist, Bernstein forged an analytical template for what is now common in the blogosphere, mainstream media and virtually everywhere else that assigns import to the money game: Reading the academic literature and interpreting it for a wider audience.

Bernstein wasn't alone in deciphering the hieroglyphics of financial economists for the masses, nor was he the first to make obscure research accessible. But few did it better. And in 1992, few were doing it all, at least not with the skill and depth that was Bernstein's trademark.

Surely the history of financial education will record 1992 as a minor milestone: the year when Bernstein's Capital Ideas: The Improbable Origins of Modern Wall Street was published. As best sellers go, it was an unlikely success. Who would have thought that telling the story of how financial theory evolved could have been such a popular topic?

As a young journalist reading the book for the first time in the summer of 1992, I was stunned and amazed to learn of the efforts that had spilled forth from practitioners and academics over the years in trying to figure out how the market prices securities. I had a vague idea that the intellectual quest to uncover the hidden rules of money management had been unfolding for decades, and that index funds were the chief byproduct of those efforts. But it was Bernstein who brought the ideas to life. His great achievement is explaining the context and application for readers in a way that made the theories accessible to a wider audience.

The ideas of modern portfolio theory (MPT) were, of course, well known in certain money management circles in 1992. Twenty years earlier, institutional investing first became captivated with the concepts of portfolio optimization, the capital asset pricing model and the efficient market hypothesis—ideas that had been fermenting in academia since the 1950s. In the seventies, the concepts attracted real money.

The rest, as they say, is history, but no one will confuse it with the end of history. To say that the capital ideas, as Bernstein called them, remain controversial is an understatement. Although trillions of dollars now reside in index funds the world over, it's fair to say that the underlying theories that spawned the products remain contentious. Active management, which is to say something other than indexing, still dominates the money game, and probably always will.

That's partly a reflection of the money game. Investing, unlike the hard sciences, can never be "solved," forever keeping alive the hope that greener pastures await over the next hill. What appears to work today sometimes looks questionable, if not irrelevant tomorrow, inspiring investors to dig deeper, think differently and otherwise look for superior strategies.

To the extent that there are enduring truths in investing—a debatable idea on its own—some of those truths appear to be captured in the capital ideas, which offer valuable perspective for thinking about the nature of markets and the process of designing and managing portfolios.

No, capital ideas aren't perfect, but neither are they a static set of ideas resistant to change, as some pundits incorrectly assume. In a book I'm finishing up for Bloomberg Press (tentatively titled Dynamic Asset Allocation), I review some of the critical changes in the academic literature over the last 30 years in an effort to show how modern portfolio theory has evolved. One of the inspirations for undertaking a project which has consumed much of my spare time over the past several years is, of course, Peter Bernstein.

But while capital ideas continue to progress, the core lesson is still unchanged. Risk, in short, is the key to understanding the markets. No surprise, then, that risk is the recurring theme in what I consider the must-read trio from Bernstein: Capital Ideas, along with its sequel: Capital Ideas Evolving and also Against the Gods: The Remarkable Story of Risk.

You may or may not agree with MPT, but reading these three books can only make you a wiser investor. Academics aren't omniscient, but they have turned up some useful ideas over the past 50 years, and some of those ideas are worthy of deeper study. Peter Bernstein does a masterful job of telling us why.

In essence, the crucial lesson is that we're all risk managers now. The details remain controversial, but to the extent that investors recognize this basic challenge suggests that finance has enjoyed a bit of progress through time.

On that point, all strategic-minded investors owe a debt of gratitude to Peter Bernstein. He didn't invent capital ideas, but few have done a better job of explaining the underlying principles.

Lunch is for wimps

Lunch is for wimps
It's not a question of enough, pal. It's a zero sum game, somebody wins, somebody loses. Money itself isn't lost or made, it's simply transferred from one perception to another.