Monday, October 31, 2011

Say What? In 30-Year Race, Bonds Beat Stocks


The biggest bond gains in almost a decade have pushed returns on Treasuries above stocks over the past 30 years, the first time that’s happened since before the Civil War.
Fixed-income investments advanced 6.25 percent this year, almost triple the 2.18 percent rise in the Standard & Poor’s 500 Index through last week, according to Bank of America Merrill Lynch indexes. Debt markets are on track to return 7.63 percent this year, the most since 2002, the data show. Long-term government bonds have gained 11.5 percent a year on average over the past three decades, beating the 10.8 percent increase in the S&P 500, said Jim Bianco, president of Bianco Research in Chicago.
The combination of a core U.S. inflation rate that has averaged 1.5 percent this year, the Federal Reserve’s decision to keep its target interest rate for overnight loans between banks near zero through 2013, slower economic growth and the highest savings rate since the global credit crisis have made bonds the best assets to own this year. Not only have bonds knocked stocks from their perch as the dominant long-term investment, their returns proved everyone from Bill Gross to Meredith Whitney and Nassim Nicholas Taleb wrong.
“The generation-long outperformance of bonds over stocks has been the biggest investment theme that everyone has just gotten plain wrong,” Bianco said in an Oct. 26 telephone interview. “It’s such an ingrained idea in everyone’s head that such low yields should be shunned in favor of stocks, that no one wants to disrupt the idea, never mind the fact that it has been off.”

Market Returns

Stocks had risen more than bonds over every 30-year period from 1861, according to Jeremy Siegel, a finance professor at the University of Pennsylvania’s Wharton School in Philadelphia, until the period ending in Sept 30.
U.S. government debt is up 7.23 percent this year, according to Bank of America Merrill Lynch’s U.S Master Treasury index. Municipal securities have returned 8.17 percent, corporate notes have gained 6.24 percent and mortgage bonds have risen 5.11 percent. The S&P GSCI index of 24 commodities has returned 0.25 percent.

Falling Yields

While 10-year Treasury yields rose 10 basis points, or 0.10 percentage point, last week to 2.32 percent, they are down from this year’s high of 3.77 percent on Feb. 9. The price of the benchmark 2.125 percent note due August 2021 fell 27/32, or $8.44 per $1,000 face value, in the five days ended Oct. 28 to 98 10/32, according to Bloomberg Bond Trader data.
The yield dropped 11 basis points today to 2.21 percent at 10:21 a.m. in New York.
The shift to debt wasn’t anticipated by Gross, who as co- chief investment officer of Newport Beach, California-based Pacific Investment Management Co. runs the world’s biggest bond fund. His $242 billion Total Return Fund, which unloaded Treasuries in February before the rally, has gained 2.55 percent this year, putting it in the bottom 18th percentile of similar funds, according to data compiled by Bloomberg.
Whitney, a banking analyst who correctly turned bearish on Citigroup Inc. in 2007, predicted in December “hundreds of billions of dollars” of municipal defaults that haven’t happened. Taleb, author of “The Black Swan” and a principal at Universa Investments LP, said at a conference in Moscow on Feb. 3 that the “first thing” investors should avoid is Treasuries.

What Went Wrong

The reluctance to purchase debt continues. Leon Cooperman, chairman of $3.5 billion hedge fund Omega Advisors Inc., said in a presentation at the Value Investing Congress in New York on Oct. 18 that he “wouldn’t be caught dead owning a U.S. government bond.”
What the bears failed to anticipate was that Americans would continue to pare debt and boost savings. Much of that money found its way into the fixed-income markets as banks and investors sought high-quality debt as unemployment held at or above 9 percent every month except for two since May 2009, Europe’s fiscal crisis threatened to push the global economy back into recession and stock markets fell.
“It’s hard to envision a scenario where we see significantly better than two percent growth, with increased fiscal austerity and headwinds from the leverage bubble and persistent unemployment,” said Rick Rieder, who oversees $620 billion as chief investment officer of fundamental fixed income at New York-based Blackrock Inc. The firm is the world’s largest money manager, investing $3.45 trillion.

Higher Savings

The U.S. savings rate has tripled to 3.6 percent since 2005 and has averaged 5.1 percent since the depth of the financial crisis in December 2008, compared with 3.1 percent for the previous 10 years, according to government data. Debt mutual funds have attracted $789.4 billion since 2008, compared with a $341 billion drop in equity funds, according to data compiled by Bloomberg and the Washington-based Investment Company Institute.
Banks, still trying to rebuild their balance sheets after taking more than $2 trillion in writedowns and losses since the start of 2007, have boosted holdings of Treasuries and government-backed mortgage securities to $1.68 trillion from $1.62 trillion in December, according to the Fed. Foreign investors increased their stake in Treasuries to $4.57 trillion in August from $4.44 trillion at the end of 2010, according to the latest Treasury Department data.
The bond market posted its first 30-year gain over the stock market in more than a century during the period ended Sept. 30. The last time was in 1861, leading into the Civil War, when the U.S was moving from farm to factory, according to Siegel, author of the 1994 book “Stocks for the Long Run,” in a telephone interview Oct. 25.

‘Millennium Event’

“The rally in bonds is a once in a millennium event, but it’s absolutely mathematically impossible for bonds to get any kind of returns like this going forward whereas stock returns can repeat themselves, and are likely to outperform,” he said. “If you missed the rally in bonds, well, then that’s it.”
Gross eliminated Treasuries from the Total Return Fund in February and owned derivative bets against the debt in March. He moved 16 percent of its assets into U.S. government securities as of September, saying earlier this month in a note to clients that he misjudged the extent of the economic slowdown and called his performance this year “a stinker.”
Local government bonds are set for the biggest gains since 2009 as defaults fell last quarter. Cities and states are reducing expenses instead of forgoing payments on debt even as they confront fiscal strains in the wake of falling revenue.

One Miss

Whitney said on the CBS’s “60 Minutes” in December that there would be “hundreds of billions of dollars” of municipal defaults this year. Brighton, Alabama, a city of 2,945 near Birmingham, was the only U.S. municipality to miss a general- obligation debt payment in 2011. Defaults are about 25 percent of 2010’s $4.3 billion tally, according to Bank of America Corp.
Money has poured into Treasuries even as U.S. budget deficits totaled $1.4 trillion in fiscal 2009 ended Sept. 30, $1.29 trillion in 2010 and $1.3 trillion in 2011.
Rising deficits and debt led Taleb, the distinguished professor of risk engineering at New York University, to tell investors in February that the “first thing” they should do is avoid Treasuries, and the second shun the dollar. At the same conference a year earlier he said “every single human being” should bet against U.S. government debt.

Tame Inflation

Since February Treasuries have rallied 7.99 percent and the currency has gained 3.2 percent, beating 14 of its 16 most actively traded peers, according to Bank of America Merrill Lynch indexes and data compiled by Bloomberg.
Concerns about inflation have also abated. Consumer prices, excluding food and energy, rose 0.05 percent in September, the smallest gain since October 2010, the Labor Department said Oct. 19 in Washington. Yields on bonds that protect investors from rising consumer prices suggest the fixed-income market anticipates inflation will average to 2.15 percent over the next decade, down from expectations of 2.67 percent in April.
“The Fed is legally obligated to do everything in their power to keep unemployment low, and they have and will continue to do so,” said Chris Low, chief economist at FTN Financial in New York. “As long as inflation isn’t a concern the Fed is going to keep firing until something happens,” Low said in a telephone interview Oct. 21.
Low was one of three economists in a Bloomberg survey of 72 forecasters in January to predict that 10-year Treasury yields would trade below 3 percent this quarter.

Fed Signals

Fed policy makers, who meet this week, have signaled that they are considering more measures to boost the economy, after holding the target rate for overnight loans between banks at zero to 0.25 percent since December 2008 and expanding its balance sheet to a record $2.88 trillion.
Vice Chairman Janet Yellen said Oct. 21 that a third round of large-scale securities purchases might become warranted. Last month, policy makers said they would replace $400 billion of short-term debt with longer-term Treasuries in an effort to contain borrowing costs.
“The Fed’s hope is that by pushing down Treasury rates, all other rates will follow,” Jay Mueller, who manages about $3 billion of bonds at Wells Fargo Capital Management in Milwaukee, said in a telephone interview Oct. 26.
“As a portfolio manager who has been in the business 30 years, it’s hard to come to terms where interest rates are, but you have to come to terms with it,” Mark MacQueen, who oversees bond investments at Austin, Texas-based Sage Advisory Services Ltd., which manages $9.5 billion, said in an Oct. 26 telephone interview. “And when you look at what stocks have done this decade it becomes much easier.”
Investors wish for liquid hedge funds

In the current economic uncertainty, pension funds and other institutional investors are increasingly turning to liquid hedge fund strategies as they seek to have easy access to their money in shifting conditions.
 
Wishing well: investors seek more liquid strategies such as global macro or managed futures 

In a survey last month of institutional investors by data provider Preqin, 12% of respondents said that during this period of volatility they were exclusively looking at liquid investment strategies in their hedge fund portfolios, while 30% would not consider funds that have a lock-up period.
Olivier Cassin, head of research and development at investment consultant bfinance, said: “When there’s uncertainty in the market and heavy government intervention on monetary and fiscal policy, for most of our clients, access to capital outweighs the illiquidity premium that comes from locking up capital. Right now investors desire liquidity far more than the opportunity cost of potentially missing out on a few percentage points of performance.”
Greg Clerkson, director of alternative investments at consultant Russell Investments, said that while there were good opportunities to invest in credit hedge funds, investors were not willing to lock up their money in the face of the current economic uncertainty. He said: “If you go into more liquid strategies such as global macro or managed futures, you can get your money back quickly and, historically, both have shown some degree of equity offset. It’s optionality as much as anything. Historically, it has worked and if it doesn’t work you can get out.”
Economic trends
Managed futures strategies use computer models to try to capture trends in a range of global markets. Global macro is a strategy that trades instruments such as currencies, interest rates, foreign exchange and bonds to take advantage of broad economic trends.
Guy Saintfiet, UK head of liquid alternatives at Aon Hewitt, said that for the past 12 months his firm has been advising clients to add more exposure to global macro and managed futures. He said this was driven by investment opportunity, not liquidity and added: “We believe that these strategies are best placed to capitalise on an environment where markets are driven by high-level newsflow and are not trading on bottom-up fundamentals.”
Saintfiet said that since the financial crisis, pension funds had been focusing on more appropriate liquidity rather than more liquidity. He said that their reaction to Ucits funds, a regulated structure that gives clients access to their money at least twice a month, reflected this. Saintfiet said: “We’ve had very little interest in Ucits from pension funds. In return for the higher liquidity, you typically give up quite a lot of return potential and they don’t want to make that trade-off.”
With assets in the roughly $2 trillion hedge fund industry reaching new highs, the composition of the investor base has changed significantly since the financial crisis. Preqin estimates that 61% of hedge fund capital comes from institutional investors, compared with 45% before the crisis.
Three quarters of respondents to Preqin’s survey said they needed greater liquidity in their hedge fund portfolios in the post-financial crisis period than they had needed previously.
According to Robert Howie, head of alternative investment at consultant Mercer, this is unsurprising. He said: “I can see why there is a focus on liquidity. During the crisis, clauses were suddenly invoked that were very vague and many investors found themselves dealing with gates, side-pockets and suspended redemptions.”
Howie said that investors should look to see that the fund’s liquidity matches its underlying instruments. He said: “Moreover, liquidity is not something that is constant. Investors need to understand what managers will do if their instruments and markets become illiquid.”
Clerkson at Russell said that investors had become much stricter on insisting that the investment mandate should fit the fund’s liquidity terms. He said: “We will give you the discretion but we will put the rules around it. There’s very little benefit of the doubt to be had. Investors have become less tolerant of managers going outside their mandates. There’s very little appetite for a supposedly liquid product with an option to go illiquid without the investor having the call.”
From a manager’s perspective, pension fund capital is attractive because it is perceived to be stable and long term in its mindset. But consultants said that pension funds were keen to ensure that their long-term outlook did not leave them at a disadvantage. Aon’s Saintfiet said: “Institutional investors need to worry about being liquidity providers to a failing business or to other investors with a shorter-term time horizon. During the crisis, people who were locked in for longer ended up holding the baby and the cost for them was much higher than the fee discount they received.”
Investor lock-in
Saintfiet said that pension funds were avoiding managers looking to protect their businesses with overly harsh liquidity terms. He said: “Our focus is on identifying the best managers with appropriate liquidity and a stable client base of preferably institutional investors. There has to be a good reason to lock in your money for longer. It is not really good enough when it’s just about protecting a firm from redemptions and being the last one out.”
Clerkson said: “An investor-level lock is perceived as something that only benefits the manager. Sometimes there is a good reason for it but investors need to understand the rationale.”
Is there a danger that investors are missing out on some good investment opportunities by insisting on investing in liquid strategies? Cassin at bfinance said: “In dislocated markets, there are a lot of opportunities for those with cash and time on their hands.”
But he said that, while pension funds are mainly investing their hedge fund allocations in liquid investments, elsewhere they are more willing to forgo access to their money and gain exposure to the greater returns this can bring. He said: “At an overall portfolio level, we’re seeing a search for yield that is leading investors to look at real assets such as infrastructure, real estate and some private equity. We also see many attractive direct and secondary opportunities at the moment.”

Friday, October 21, 2011

Dividend Investing


Seeking Alpha – Why Dividends Matter In A Changing Market [1]
Lately, it seems that dividend investing has become all the rage. Articles are being written at just about every financial site, talking about dividends. When you look at Money Watch, MSN Money, Kiplinger, Money Magazine, Forbes, Smart Money, and even here at SA, there is no shortage of dividend investing commentary…Mark Hulbert has written an article that I think you might find interesting. He says:
Believe it or not, the stock and bond markets are behaving in a way that, with only one exception at the depths of the 2008-2009 credit crisis, they have not since 1958—53 years ago: The stock market’s dividend yield is now above the interest rate on the 10-year Treasury note.
With dividend yields outpacing the 10 year Treasuries, perhaps we are beginning to see a paradigm shift back to that pre-1958 market model. Investors can now find companies that have a history of paying dividends, companies that are increasing those dividends annually, and companies that have the earnings power to continue making those dividend payments. Dividend investing may very well become the norm moving forward.
Comment
In our current uncertain and volatile environment, investors are seeking safety.  So, it should come as no surprise that dividend stocks have gained in popularity especially since many blue-chip stocks pay higher dividend yields?
However, any case for a new era of dividend investing may be a bit overstated.  Dividend stocks should simply be viewed as a slightly less risky form of stock investing.  As such, we should expect dividend-paying stocks to outperform during bear markets and underperform during bull markets.
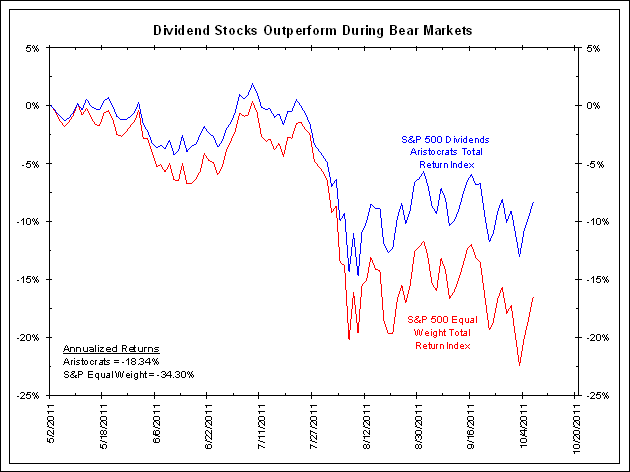
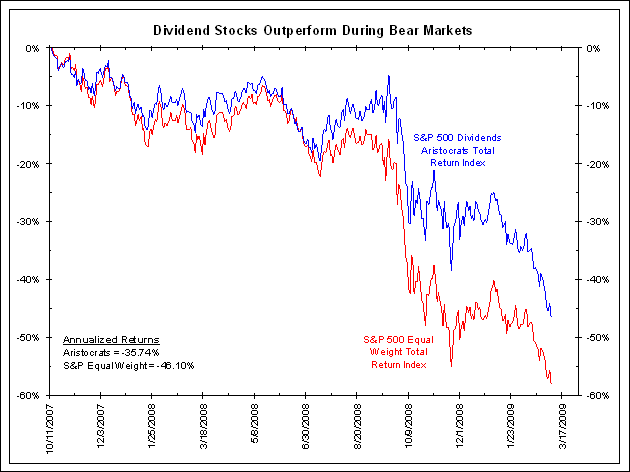
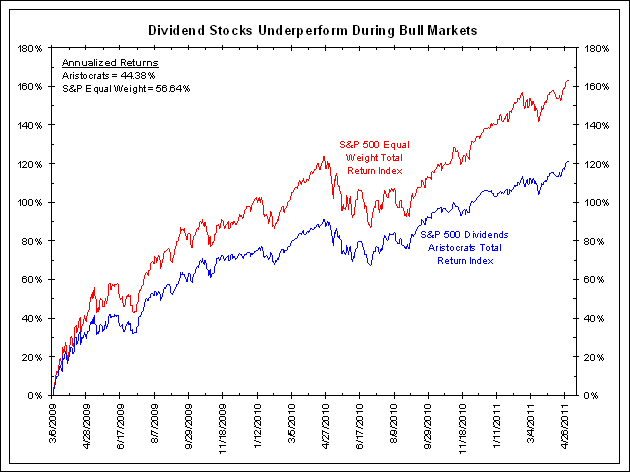
By comparing the S&P Dividends Aristocrats Total Return Index [2] and the S&P Equal Weight Total Return Index [3], we can see this is indeed the case.  The S&P Dividends Aristocrats Index measures the performance of stocks in the S&P 500 that have consistently increased dividends for at least 25 consecutive years.  The index is equally weighted, so we compare its total return to that of the S&P 500 Equal Weight Index.
During the bear market from October 11, 2007 to March 6, 2009, dividend-paying stocks outperformed the S&P 500 Equal Weight Index by 11.6%.  On an annualized basis, dividend stocks returned -35.74% versus -46.10% for the S&P Equal Weight Index.
.
 [4]
.
During the bull market from March 6, 2009 to May 2, 2011, dividend-paying stocks underperformed the S&P 500 Equal Weight Index by 42.4%.  On an annualized basis, dividend stocks returned 44.38% versus 56.64% for the S&P Equal Weight Index.
.
 [5]
.
Finally, during the bear market from May 2, 2011 through last Thursday’s close, dividend-paying stocks outperformed the S&P 500 Equal Weight Index by 8.19%.  On an annualized basis, dividend stocks returned -18.34% versus -34.30% for the S&P Equal Weight Index.
.
 [6]
To be sure that these past few bull/bear markets were the rule and not the exception, we also compared total returns of these two indices on all days when the S&P Total Return Index was up versus all days when the S&P Total Return Index was down. With data going back to the beginning of 1990,dividend-paying stocks returned an average of 66 basis points per day on days the stock market was up.  The S&P Equal Weight Index returned an average of 77 basis points per day on those same days.  On days the stock market was down, dividend-paying stocks returned an average of -67 basis points per day.  The S&P Equal Weight Index returned an average of -80 basis points per day.
Rather than being concerned with reaching for yield, the charts and data above suggest dividend stocks outperform during bear markets and underperform during bull markets.  However, if investors are savvy enough to know which way the market was heading in general, why even bother distinguishing between dividend-paying stocks and non-dividend-paying stocks?
Source:
Bianco Research, LLC.

Thursday, October 20, 2011

Stocks Have a Fever, and the Only Prescription Is More Correlation

Why buy or sell one stock when you can just trade them all?
A popular indicator among the stock market technician types are “90%” up or down sessions, days when 90% of the stocks in the S&P 500 move in the same direction.
But in this risk on/risk off world in which we all live, 90% days are happening with remarkable frequency.
Courtesy of Chris Verrone at Strategas Research Partners, we have these charts, which pretty much tell the story. The first chart shows how the number of these days has exploded since 2007.
What’s noteworthy in the second chart is the difference between the first half of 2011 and the tally for the past three-and-half  months. Since the end of June, we’ve had more 90% days than in all of 2007, and more than the entire period stretching from 2002 through 2006 combined.
The reasons at this point are well known: rolling financial crises and the explosion of exchange traded fund trading which has made whipping around baskets of stocks a breeze. At this point, there’s little on the horizon to suggest this trend will change soon.

Chart of the Day - S&P vs Earnings

Wednesday, October 19, 2011

Is Klarman’s Baupost Seeking Cash from Investors?


Seth Klarman’s Baupost might soon be looking to raise some cash. The super-secretive hedge fund manager, known for his conservative, measured investing approach, is considering asking his existing investors to give back some of the cash he returned earlier in the year, according to a knowledgeable source.
The source says Klarman is definitely not soliciting outside money, as he did for a short while several years ago.
In early 2008, for the first time in eight years, he opened his funds to new money, drawing on his long waiting list. Klarman pulled in about $4 billion from foundations, educational institutions ­— especially Ivy League schools — and existing investors who had one shot at deciding whether they were in or not before the door was shut tight again.
At the end of 2010, he gave back 5 percent of his total assets to investors.
Now he is seriously mulling whether to ask for that money back. However, he is definitely not opening to new investors. If he seeks cash, it would be from those earlier recipients, says a knowledgeable source.
The hedge fund manager told clients in a letter this summer that he is generally bearish on the global economy and concerned about the debt woes in Europe.
Still, the fact he is seeking cash from any source is somewhat encouraging. According to the knowledgeable person, Klarman generally feels there are certain times you want cash available and this may be one of those times.
Baupost, which at year-end was the eleventh largest hedge fund in the world with $23.4 billion under management, was down slightly in the rough third quarter and is roughly flat year-to-date. It has outperformed the S&P 500 virtually every year in the past decade, and its oldest partnership has generated a approximately 19 percent annualized return since inception in 1983.
Klarman is known as a global value sleuth, deftly exploiting virtually any undervalued market, including domestic and foreign stocks and bonds; emerging market securities; distressed securities and trade claims; performing and nonperforming bank loans; real estate-related debt and equity; privately negotiated investments; and other illiquid investments.
He earned a BA in economics from Cornell University in 1979, graduating magna cum laude. He was first exposed to value investing principles working during the summer of his junior year at New York’s Mutual Shares, the legendary value-driven mutual fund firm founded in 1949 by Max Heine, and also headed by Michael Price, who in his 20s had become a Heine protégé.
Upon graduation, Klarman returned to Mutual Shares, and after 18 months he left the firm for Harvard Business School, where he earned his MBA and was named a Baker Scholar. He fatefully took a real estate course with professor Bill Poorvu, who asked Klarman to help him and his friends invest their considerable sums of money. Baupost was born.
In his second quarter letter sent to clients in July, Klarman was very worried about the European debt crisis and was concerned that American banks had too much exposure to European debt. As a result, he even feared money market funds might “break the buck,” as happened in 2008.
He is said to have told clients that little has been learned and almost nothing has changed, and that the next crisis could be far worse.
He also was pessimistic about the prospects for the economy, given the huge budget deficits and other negative developments.
Even so, the bottom-up investor stressed it is still possible to find specific investments to be undervalued. At the time he said he added selectively to residential mortgage backed securities and individual securities.
According to regulatory filings, in the second quarter he increased his exposure to U.S. equity-type instruments by more than one-third, to $2.4 billion, compared with the prior quarter. It was spread over just 20 different names. His biggest positions were in Viasat, which produces satellite and other digital communication products and of which Baupost is the largest shareholder; Microsoft, a new position in the second quarter; Newscorp; and Theravance, a biopharmaceutical company.

Tuesday, October 18, 2011

The New Abnormal: Inflation Expectations & The Stock Market

There's a rumor going around that the crowd's worried about inflation. Tim Bond of Odey Asset Management speaks for many of this persuasion when he writes in the Financial Times that "the rise in inflation has been the main factor responsible for the sharp slowdown in global growth since the start of the year." Normally, worrying about pricing pressures is an accurate description of how the capital markets respond to higher inflation expectations, and rightly so. Inflation is a corrosive force that eats into wealth. But these aren't normal times.
As a barometer of how abnormal things are, consider the unusually tight relationship between the stock market and the market's inflation forecast, as defined by the yield spread in the nominal 10-year Treasury less its inflation-indexed counterpart. Normally, there's minimal correlation between price changes in the stock market and the market's inflation outlook. The two markets more or less go their separate ways. But in the wake of the financial crisis in late-2008, the normal state of affairs has given way to aberration, as the chart below shows.

Over the past year, for instance, the stock market's moves have been tightly correlated with changes in inflation expectations. Equities tend to rally when the Treasury market anticipates higher inflation, and vice versa. This relationship suggests "that investors don’t fear inflation, they yearn for it," as David Glasner explains. A formal economic explanation for what's happening can be filed under the heading of the "The Fisher Effect Under Deflationary Expectations," the title of a paper by Glasner.
The source of the problem, as Charles Evans of the Chicago Fed suggests, is an erosion of the central bank's credibility though a monetary policy of passive tightening. Speaking at a conference yesterday, Evans reviewed the challenges and the framework for a solution, if only a partial one:
Given the economic scenario and inflation outlook I have discussed, if it were possible, I would favor cutting the federal funds rate by several percentage points. But since the federal funds rate is already near zero now, that’s not an option. To date, the Fed’s policymaking committee, the FOMC, has used a number of nontraditional policy tools to impart greater financial accommodation. I have fully supported these policies. However, I would argue for further policy actions based on our dual mandate responsibilities and the strong impediments of the financial crisis.
Evans goes on to say that the "current financial conditions are more restrictive than I favor, in part because households, businesses and markets place too much weight on the possibility that Fed policy will turn restrictive in the near to medium term." Marcus Nunes simplifies the issue and simply notes that Bernanke "loses it," a reference to the Fed head's former promise to Milton Friedman that he understood the implications of the Fed's past mistakes in the 1930s and would do better in the future.
Changing the expectation that the Fed won't do more won't be easy, in part because central banks have fought long and hard to promote their inflation-fighting credentials and, well, it's hard to teach old dogs new tricks. But inflation fighting at the moment isn't appropriate, according to Evans: "Given this strong anti-inflationary orientation of central bankers, appropriate policy actions may face a credibility challenge of a different nature than we are used to talking about — can conservative central bankers be counted on to commit to keeping interest rates low in the event inflation rises above their long-run target?"
The answer seems to be "no," or so the high correlation between the stock market and inflation expectations imply. If there's any change, we'll likely see it in a disconnect between equity prices and the Treasury market's outlook for inflation. Meantime, the (unfulfilled) yearning continues.

Monday, October 17, 2011

Commodities and (a Lack of) Diversification


Over recent years, commodity indices have become increasingly correlated with the U.S. stock market, and today, provide little in the way of diversification.
To illustrate, below is the 3-year monthly correlation between the Goldman Sachs commodity index (ETF GSG) and the S&P 500, from 1970. Note right side of graph.
The Goldman Sachs index is the least diversified of the major commodity indices, but this observation extends to all the majors.
Below I’ve compared the GS index (red) to the CRB, Dow Jones-UBS (ETF DJP), and Deutsche Bank (ETF DBC) indices in blue. Note the similar results.
Of the major asset classes, only corporate bonds, Treasuries and gold (and currencies if you view that as an asset class) provide any level of real diversification to equities in this market.
Asset classes which have in the past exhibited low correlation, including: commodities, international stock indices (developed and emerging markets), and real estate, all continue to see high levels of correlation to U.S. equities.
This hurts strategies that use diversification as a way to reduce portfolio volatility, whether it’s traditional MPT or something more active like Tactical Asset Allocation.
None of this is new information and I’m not the first to highlight it – just something that we as investors need to keep on the radar. Reducing portfolio volatility through diversification continues to become more and more difficult.

Farmland Is Pricey. The Fed Is Worried

Regulators don't want a repeat of the subprime crisis

When regulators come inquiring about loan risks at the Bank of Newman Grove, in Newman Grove, Neb., Jeffrey L. Gerhart, the chairman of the $35 million lender, has a “stress test” ready to show how his bank’s portfolio would fare if rural land prices dropped 25 percent. Or 50 percent. Or even 75 percent.
“I hope it’s not going to go to heck in a handbag out here, but this allows us to look at those worst-case scenarios,” says Gerhart, a fourth-generation banker in this 800-person town two hours west of Omaha, in the heart of the corn and soybean belt. He began stress-testing in the last two years after prodding from the Federal Reserve Bank of Kansas City.
Farmland prices were 30 percent higher in Nebraska in the second quarter than a year ago, according to a survey by the Kansas City Federal Reserve Bank, driven by elevated crop prices, soaring farm income, and record-low interest rates. That’s the high end of increases in cropland valuations of 8 percent and more in the region stretching from Oklahoma to North Dakota and from Nebraska to Michigan. Last March these increases prompted Yale University economist Robert J. Shiller to call farmland his “dark-horse bubble candidate for the next decade.”
Shiller’s warning has the Federal Reserve on guard, based on interviews with Fed regulators, economists, and policymakers. His prediction of a housing bubble in a 2005 edition of his book Irrational Exuberance proved prescient. Regulators missed the risks in residential and commercial real estate that led to the subprime crisis. So examiners at regional Federal Reserve banks and the Federal Deposit Insurance Corp. are scrutinizing the lending standards, loan documentation, and risk management at the country’s 2,144 agriculture banks.
Regulators have highlighted the risks in a series of sessions. The Farm Credit Administration hosted a roundtable in February. The FDIC sponsored a “Don’t Bet the Farm” symposium in March. In July the Kansas City Fed organized a conference on “Recognizing Risk in Global Agriculture.” That conference included officials from the FDIC, the Agriculture Dept., Farmer Mac (AGM) (which functions like Freddie Mac (FMCC)), the Office of the Comptroller of the Currency, the Farm Credit Administration, the Federal Reserve banks of Minneapolis, Chicago, and Dallas, and the Fed’s Board of Governors. The group considered questions such as what would happen if crop prices fell by half, if government subsidies for agriculture or ethanol disappeared, or if land prices tumbled by 30 percent or more.
“It’s not that we think this is going to be the most likely outcome,” says Jason R. Henderson, the Kansas City Fed’s lead agricultural economist. “It’s a discussion of the black swans and fat tails—the low probability events that catch people off guard.”
The Fed’s Beige Book, an anecdotal survey of economic conditions released on Sept. 7, reported that “farmland values rose further” in several districts even as “harsh summer weather strained agricultural activity.” The Kansas City Fed reported land values were 20 percent higher than a year ago. The Chicago Fed reported a 17 percent increase in its district, the fastest increase since the 1970s. Nonirrigated farmland in the Minneapolis Fed district increased 22 percent in price.
At the peak of the housing bubble, real estate prices were rising 17 percent year over year, according to the S&P/Case-Shiller index of property values in 20 cities. Seasoned bankers see a disturbing similarity with the farm boom, as former Kansas City Fed Chief Executive Officer Thomas M. Hoenig told the Senate Agriculture Committee in testimony earlier this year. Hoenig’s big worry, he said, is that imbalances in asset prices “will catch agriculture—and the U.S. economy more generally—by surprise once again.”
Farmland values soared in the 1970s, rising as much as 28 percent in 1976. In the early 1980s the bubble burst, and land prices collapsed. Memories of the 1970s have made regulators and bankers more cautious this time, says David B. Oppedahl, a Chicago Fed economist who compiles the bank’s AgLetter.
On occasion, bankers have found regulators overzealous, says John Blanchfield, who runs the ABA Center for Agricultural & Rural Banking at the American Bankers Assn. “The FDIC is convinced there’s a bubble, and they’re not going to miss this bubble, by God,” he says. Regulators are concerned about banks’ concentrations of agriculture loans, he adds. “How are these bankers supposed to respond to that? Every direction in 500 miles from their bank is cornfields.”
The bottom line: U.S. farmland prices have risen up to 30 percent this year. Regulators and bankers are working to avoid a repeat of the 1970s boom and bust.

The real bull market; Why Americans are making pensions out of prairies


Thursday, October 13, 2011

Indexer? Valuation Still Matters


Indexing is based on a simple proposition: Net of fees the markets are hard, if not impossible, to beat. The proposition has been tested many times, with supportive results. No surprise then that passive funds' market share has surged to 24% from 11% of all open-end and exchange-traded fund assets over the past decade. But indexing's well-deserved success has coincided with a disturbing abrogation of responsibilities by some investors and advisors. Many believe that they can't or shouldn't estimate expected returns of their investments. They've consigned valuation to the dustbin.
This is wrongheaded, motivated by a view of markets rejected decades ago. The early efficient-market theorists assumed that the market's expected returns, risks, and correlations were constant through time. Almost no financial economist believes this today. The market's expected returns change. And there's heaps of evidence that the market's returns are somewhat predictable over long horizons.
Market Predictability
On an intuitive level, the market must be predictable to some extent. Otherwise, how could investors set prices for stocks versus bonds versus cash? We can also reasonably rule out certain scenarios, such as corporate earnings growing much faster than gross domestic product indefinitely, which would result in corporate earnings eventually taking over the entire economy. That returns are bounded by mean-reverting attributes of the economy points to predictability. Indeed, the evidence is compelling. In the August 2011 issue of The Journal of Finance, University of Chicago professor John Cochrane wrote: ". . . predictability is pervasive across markets. For stocks, bonds, credit spreads, foreign exchange, sovereign debt, and houses, a yield or valuation ratio translates one-for-one to expected excess returns, and does not forecast the cashflow or price change we may have expected." In other words, measures such as dividend/price predict future returns, especially over long horizons. Cochrane is a prominent efficient-markets theorist.
Adding return predictability to classical asset-pricing models, with changing risk, correlations, and expected returns, has surprising implications. In many cases, the hallowed market portfolio, containing all assets in the market weights, no longer guarantees the most return per unit of risk. There's no need to privilege total stock and bond market indexes, or static buy-and-hold strategies. The more realistic models suggest investors should time the market depending on how affected they are by recessions and their estimates of expected returns. An investor who can stomach a lot of volatility should increase his exposure to risky, high-expected-return assets during bad times. This sounds an awful lot like the dictum to "buy when there's blood in the streets." But everyone can't buy at the same time, nor should they. Investors with income or wealth sensitive to the business cycle should put less of their portfolios in value stocks, which are especially hurt by recessions, and possibly even hedge their exposures to their specific industries.
These new and improved models have their impracticalities. Until recently, sticking with a plain market-weighted index fund was perhaps the best course of action for the vast majority of investors. Trading was prohibitively expensive, and it was difficult to cheaply tailor one's exposures to various risk factors. No longer, as decimalization, financial innovation, and competition have slashed costs and expanded the menu of indexlike investments. Investors should take advantage of these circumstances to tailor more-efficient portfolios. However, demanding that advisors and individuals constantly update for every asset class estimate of expected returns, correlations, and standard deviations is impractical. A compromise is to adjust portfolio allocations based on expected returns, perhaps the most important of all three factors. As we'll see, estimating long-run (over a decade or more) expected returns isn't terribly hard.
Expected Returns
Most expected returns can be decomposed into three parts: the current cash flow yield, the cash flow's expected growth rate, and the expected change in valuation (for example, a contraction or expansion of the dividend/price multiple). However, of the three, change in valuation multiples is often the least predictable, most volatile, and the least important in the long run, so investors should focus on current yields and expected cash flow growth. Current yields are easy to find. The trick, then, is to find the most appropriate and predictive cash flow growth figure. Fortunately, long-run historical growth rates provide a decent guide. For most major stock markets, dividend growth has averaged 1% to 2% annualized over the past century. For bond indexes, expected cash flow growth is negative owing to defaults. For U.S. Treasuries and investment-grade bonds, the default rate has historically been zero or close to it, so current yield (or better yet, real option-adjusted yield) provides a good guide to expected returns. According to Antti Ilmanen, U.S. high-yield bonds have since 1920 lost about 4.3% of value annually to defaults (2.6% after a 40% recovery rate is included).

Adding a few bells and whistles seems to help forecasting power, but they're beyond the scope of this article. GMO, a respected asset manager, adds mean reversion in its models. An investor without the time, data, or inclination to estimate expected returns probably would do well to follow the regular valuation estimates GMO publishes for free at its website (registration required, unfortunately).
This doesn't mean you're guaranteed to earn those returns, even over several decades. All an expected return estimate does is offer you a decent idea of the average of the many possible return streams you can reasonably expect from your investments.
Portfolio Implications
How could you integrate expected returns into a portfolio strategy? It could help determine your savings rate. Ask yourself whether you're satisfied with the reward you're expected to earn for deferring consumption. Would you save the same amount if you're only expected to be paid 2% annualized versus 30% annualized on your portfolio? Probably not, yet many investors don't even take a stab at estimating expected returns.
The notion that valuations matter and predict returns is closely related to the idea of recession risk. If high expected returns came with no qualifications, then beating the market would be a cinch. Many efficient-market theorists think of assets with high expected returns as riskier. This means that an exceptionally patient, risk-tolerant investor with a safe job could act as an insurer, buying distressed assets with high expected returns during recessions and liquidity crises. If he's unable or unwilling to monitor the markets for high expected return opportunities, he could maintain a static allocation to value strategies that buy high-yielding or low-price/book stocks. Or he could compromise between market-timing and buy-and-hold by overweighting beaten-down assets during annual or biennial rebalances, a technique advocated by William Bernstein.
The opposite would hold true for an investor sensitive to the business cycle. Perhaps he owns a small business or works in finance. He could overweight high-quality growth stocks and in some cases could justifiably engage in "reverse market-timing," selling stocks when volatility picks up (usually accompanied by market declines), as an insurance scheme.
Integrating expected returns into portfolio strategy just scratches the surface of efficient portfolio construction. In an ideal world, investment bankers would hold few equities and lots of long-duration Treasury Inflation-Protected Securities; landlords would short REITs; bankruptcy lawyers would sell volatility. All of this would be done with an eye toward maximizing the risk/reward characteristics of investors' true portfolios, which include human capital, pensions, and so forth, in addition to stock and bond holdings. In the real world, individuals and advisors are sorely lacking in the tools, data, and knowledge to properly implement such strategies. The very least we can do is assess whether our investments offer prospective rewards commensurate with the risks we bear. And that requires a valuation-based view of the world.

Monday, October 10, 2011

Just how stretched is the 10y?


Really stretched.  The bottom histogram is the percentage which the 10y yield deviates from its 10y (linear regression) trend. We've only been here once before, during the height of the credit crisis in late 2008/early 2009.
Even if you're bearish on the global economy, or expect hard deflation, the pay-off in betting large on US government bonds seems particularly unattractive at this point.

Wednesday, October 05, 2011

A Few Simple Rules For Money Managers to Improve Performance


One of the biggest hazards of being a professional money manager is that you are expected to behave in a certain way: You have to come to the office every day, work long hours, slog through countless e-mails, be on top of your portfolio (that is, check performance of your securities minute by minute), watch business TV and consume news continuously, and dress well and conservatively, wearing a rope around the only part of your body that lets air get to your brain. Our colleagues judge us on how early we arrive at work and how late we stay. We do these things because society expects us to, not because they make us better investors or do any good for our clients.

Somehow we let the mindless, Henry Ford–assembly-line, 8:00 a.m. to 5:00 p.m., widgets-per-hour mentality dictate how we conduct our business thinking. Though car production benefits from rigid rules, uniforms, automation and strict working hours, in investing — the business of thinking — the assembly-line culture is counterproductive. Our clients and employers would be better off if we designed our workdays to let us perform our best.
Investing is not an idea-­per-hour profession; it more likely results in a few ideas per year. A traditional, structured working environment creates pressure to produce an output — an idea, even a forced idea. Warren Buffett once said at a Berkshire Hathaway annual meeting: “We don’t get paid for activity; we get paid for being right. As to how long we’ll wait, we’ll wait indefinitely.”
How you get ideas is up to you. I am not a professional writer, but as a professional money manager, I learn and think best through writing. I put on my headphones, turn on opera and stare at my computer screen for hours, pecking away at the keyboard — that is how I think. You may do better by walking in the park or sitting with your legs up on the desk, staring at the ceiling.
I do my best thinking in the morning. At 3:00 in the afternoon, my brain shuts off; that is when I read my e-mails. We are all different. My best friend is a brunch person; he needs to consume six cups of coffee in the morning just to get his brain going. To be most productive, he shouldn’t go to work before 11:00 a.m.
And then there’s the business news. Serious business news that lacked sensationalism, and thus ratings, has been replaced by a new genre: business entertainment (of course, investors did not get the memo). These shows do a terrific job of filling our need to have explanations for everything, even random events that require no explanation (like daily stock movements). Most information on the business entertainment channels — Bloomberg Television, CNBC, Fox Business — has as much value for investors as daily weather forecasts have for travelers who don’t intend to go anywhere for a year. Yet many managers have CNBC, Fox or Bloomberg on while they work.
You may think you’re able to filter the noise. You cannot; it overwhelms you. So don’t fight the noise — block it. Leave the television off while the markets are open, and at the end of the day, check the business channel websites to see if there were interviews or news events that are worth watching.
Don’t check your stock quotes continuously; doing so shrinks your time horizon. As a long-term investor, you analyze a company and value the business over the next decade, but daily stock volatility will negate all that and turn you into a trader. There is nothing wrong with trading, but investors are rarely good traders.
Numerous studies have found that humans are terrible at multitasking. We have a hard time ignoring irrelevant information and are too sensitive to new information. Focus is the antithesis of multitasking. I find that I’m most productive on an airplane. I put on my headphones and focus on reading or writing. There are no distractions — no e-mails, no Twitter, no Facebook, no instant messages, no phone calls. I get more done in the course of a four-hour flight than in two days at the office. But you don’t need to rack up frequent-flier miles to focus; just go into “off mode” a few hours a day: Kill your Internet, turn off your phone, and do what you need to do.
I bet if most of us really focused, we could cut down our workweek from five days to two. Performance would improve, our personal lives would get better, and those eventual heart attacks would be pushed back a decade or two.
Take the rope off your neck and wear comfortable clothes to work (I often opt for jeans and a “Life is good” T-shirt). Pause and ask yourself a question: If I was not bound by the obsolete routines of the dinosaur age of assembly-line manufacturing, how would I structure my work to be the best investor I could be? Print this article, take it to your boss and tell him or her, “This is what I need to do to be the most productive.

Lunch is for wimps

Lunch is for wimps
It's not a question of enough, pal. It's a zero sum game, somebody wins, somebody loses. Money itself isn't lost or made, it's simply transferred from one perception to another.