
Monday, August 31, 2015
Wednesday, August 26, 2015
Charts, with comment. (Buy fear)
Market has demonstrated MORE fear in this move than Lehman?!?

Yes, this is a major correction. Now you have the numbers.

Bear in mind the marginal buyer/seller. Feels like ETFs/Passive (indiscriminate) are playing a large role.

For all the talk about slowing Chinese GDP and the stock market, it doesn't seem that they're all that connected. Convenient narrative?

Long Bond Outperforming...for a while now

Sentiment went from Bullish to Very Bearish --- Real Fast

In case anyone asks, What happened in China?

David Einhorn's Holdings - this month performance. Ugh.

Eurozone Credit Leading Equities Higher, ahead of Draghi in Jackson Hole

Spreads....

Bear Market Checklist

China is a big player in commodities, but not the only consumer

Manager Style and Outperformance (Illusion thereof)
Figure 1: Morningstar Style Box Performance and Percentage of Managers that Outperformed. Three years ending June 30, 2015.

Source: Morningstar magazine, August/September 2015, chart and regression by R. Ferri
Figure 1 graphically illustrates the relationship between style performance and the ability of active fund managers to outperform the style. Mid-cap Value (MV) earned 20.7% annually and outperformed all other styles; MV managers had a very difficult time outperforming this index and succeeded only about 9% of the time. In contrast, Large-cap Value (LV) earned 14.1% annually and was the worst-performing style index; LV managers had an easier time outperforming, winning about 63% of the time.
The regression is close to 85%. This means the percentage of managers who outperformed in each style is highly correlated with the relative performance of the style index. The greater a style index outperforms adjacent styles, the fewer managers outperformed in that style and vice versa.
This observation isn’t new in mutual fund analysis. William Bernstein wrote about the phenomenon in 2001 article, Dunn’s Law Review: The Life and Times of “Core and Explore,” in which he noted, “[T]he fortunes of indexing a particular asset class depend on its performance relative to other asset classes.”
The concept was expanded by William Thatcher in a 2009 article, When Indexing Works and When It Doesn’t in U.S. Equities: The Purity Hypothesis. Both articles indicate an inverse relationship between a style’s relative performance to other styles and active management’s ability to outperform in style.
This brings us to a couple of important questions. First, when do a majority of active managers outperform a poor-performing style? Second, can managers time styles and position their portfolios accordingly and make it worth investing in messy active funds?
Tables 1, 2 and 3 help answer the first question: When do a majority of active managers outperform a poor performing style? The yellow box with the red numbers in each table represents the percentage of managers that outperformed that style over a three-year period ending in June 2015. The red box represents the performance of the Morningstar style index for that category. The green box represents the performance of surrounding Morningstar style indices.

Table 1 indicates Large Cap Value (LV) managers had a great run over the three-year period ending June 2015. Almost 63% of active manager beat the Morningstar Large Value Index return of 14.1%. It’s easy to see why. The green areas in Table 1 represent the performance of adjacent styles indices: Large Core (18.3%), Mid Core (19.9%), and Mid Value (20.7%). All three had notably superior performance to Large Value. Any messy LV managers who invested outside of, but near the LV style index constituents would have added performance to their portfolio.
Table 2 shows the opposite story for Mid Cap Value (MV) managers. Only 9.0% outperformed their style index. MV was the highest-performing style of the nine style boxes, so any messiness on the part of MV managers would have hurt their performance relative to the style index – and it did.
Table 3 represents Small Cap Value (SV) managers, 33.6% of whom outperformed the Small Cap style index. Although the index performed satisfactorily at 17.0%, it underperformed the adjacent style indices, but not by as wide a margin as LV in Table 1. Accordingly, there was some benefit to active SV manages, but not enough to increase their win rate over 33.6%.
This latest evidence substantiates what Bernstein and Thatcher have indicated in the past: It appears there is no truth to the cliché that the market is inefficient in one style and not another. It’s about style performance relative to adjacent styles, and how messy managers are about remaining within a style in their equity selection.
Active fund managers look superior when their benchmark style performs poorly relative to adjacent styles, and they look bad when their benchmark style outperforms adjacent styles by a meaningful amount. Eventually, this all comes out in the wash. Active managers in every style have underperformed by about the same percentage. Please see The Power of Passive Investingfor more analysis on this topic.
The second question is easier to answer: Can active managers time styles and position their portfolios accordingly? They cannot. If they could, today’s Morningstar active versus passive results would show improvement since the time Bernstein wrote about it. But it has not. Managers do not appear to have persistent skill in timing investment styles.
Mutual fund rating services help investors compare the performance of one style to another by creating style indices, and they help investors compare the performance of funds within a particular style. But raw data can create the illusion of superior performance when none exists. You’ll need to dig deeper into a manager’s performance to determine if he or she truly has ongoing skill or if it’s just an illusion.
Monday, August 24, 2015
US asset manager warns over ‘risk parity’
AllianceBernstein, a big US asset manager, has warned that the swelling popularity of an investment strategy known as “risk parity” is exacerbating the fragility of financial markets and worsening sell-offs.
Equity and bond markets have been hit hard by fears over sliding commodity prices, China’s economic slowdown and the resulting emerging market struggles this month, heightening concerns of hidden faultlines in markets caused by certain strategies.
So-called risk parity is a next-generation passive strategy — originally pioneered by Bridgewater, the world’s biggest hedge fund group — that seeks to give equity-like returns, while providing the relative stability of bonds in a crisis.
Risk parity funds typically invest in a basket of stocks, bonds and commodities, but “leverage” the traditionally safer fixed-income bets through derivatives to ensure each asset class contributes equally to a portfolio. Simplified, the theory is that when equity markets are buoyant the extra leverage will ensure that the bond portfolio does not drag on performance, and when markets are jittery the juiced-up bond positions will ameliorate a stock slide.
The robust and consistent returns of risk parity funds in recent years has helped them swell in size and number since the financial crisis, led by hedge funds including Bridgewater and AQR. Big asset managers such as BlackRock, Invesco and AllianceBernstein itself, have also embraced the approach.
A report on bond markets by AllianceBernstein estimates that the total assets under management of RP funds could now be about $400bn, even excluding in-house RP funds in pension funds and insurers that have also embraced the strategy. With leverage that means that the RP industry now controls about $1.4tn of assets, the report estimated, not including in-house vehicles.
Douglas Peebles, head of fixed income at AllianceBernstein, compares the rise of risk parity to the invention of “portfolio insurance” in the 1980s, a tactic that was supposed to protect stock investments by using derivatives, but played a crucial part in the “Black Monday” Wall Street crash of 1987.
“It’s a core, structural change in the marketplace. Each investor is making a rational decision, but put them all together and it has caused a dramatic change in markets,” he says. “It has made the system more fragile.”
AllianceBernstein — as well as other asset managers including Pimco and GMO — point out that risk parity depends on leveraging bond investments, low volatility and modest correlations between different markets over time.
When turbulence spikes, RP funds automatically sell assets in response, but that can intensify sell-offs. Some analysts say the strategy played a crucial role in aggravating the 2013 “taper tantrum” when investors were alarmed by the Federal Reserve preparing to end its monthly bond purchases.
“Should correlations turn positive, with stocks and bonds declining at the same time, the risk contribution of each one would rise. Managers would then have to sell both to maintain their risk targets. In other words, selling begets selling,” the AllianceBernstein report said.
Mihir Worah, one of PIMCO’s chief investment officers, is less concerned about the broader dangers but warns that it is a “case of buyer beware” for investors unappreciative of the fact that the outlook for the RP strategy is dimming.
“People think risk parity is a magic bullet, but it’s not,” he said. “It’s a fundamentally good idea, but it has benefited inordinately from falling volatility and falling bond yields. But we are now entering an environment where bond yields are probably going to rise, and volatility is going to increase.”
Another risk parity fund manager argued that the strategy was misunderstood and overly maligned, pointing to tests that show that it performed well under almost any scenario. But he admitted: “Strategies that mitigate risks to make themselves more secure might make the overall system more dangerous.”
Before Today: As of Friday Nearly 70% Of S&P 500 Stocks In Correction Or Bear Market Territory
Last week's market pullback did not spare too many equities from the draw down. As of the close on Friday, 30.3% (152 issues) of S&P 500 stocks are now down greater than 20% from their 52-week highs and another 39.0% (196 issues) are down between 10% and 20% from their 52-week highs. In total nearly 70% of stocks are in correction or bear market territory. Below is a table noting this breakdown.
 |
Friday, August 21, 2015


Tuesday, August 18, 2015
Some Thoughts On Emerging Markets
Emerging Markets have been performing awfully lately. And by lately, I mean the last six years in which little progress has been made. To make matters worse, there was a huge opportunity cost of having capital allocated away from U.S. equities.

After six years of sideways movement, Emerging Markets are beginning to really move again, only in the wrong direction. Take a look at July’s performance, courtesy of Dimensional Funds. You’ll notice virtually no country was spared.
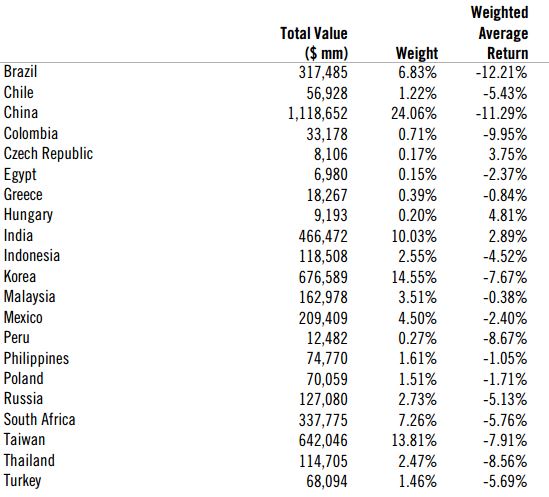
Neither was any size or style.

Or sector.

So what do we do now with Emerging Markets? That obviously depends on what sort of investor you are, what your holding period is and all the other usual caveats. For investors committed to a diversified portfolio, understand that you’ll never hold enough of what’s going up and you’ll always hold too much of what’s going down. For broadly diversified portfolios, dealing with a lousy investment is a feature, not a bug.
Did We Just Witness the Best Risk-Adjusted Returns Ever?
Risk-adjusted return measures have been around for some time now, but following the financial crisis professional money managers and asset allocators zeroed in on these formulaic performance metrics like never before. One of the most well-known risk-adjusted return formulas, the Sharpe Ratio, is simple a measure of return per unit of risk. It takes the annual returns on an investment, subtracts the risk free rate of return (in most cases that’s cash or t-bills) and divides that by the investment’s standard deviation or volatility.
Far too many investors confuse risk measurement with risk management so I’ve never been completely sold on volatility as a measure of risk, but plenty of people have become enamored with it because it provides something tangible they can define. My problem is that volatility can’t measure consequences, only the variation in returns. It says nothing of the other risks you took to get that variation. Volatility only matters when it causes investors to make unforced errors, so in that sense it can be a type of risk, both in terms of investor behavior and career risk for portfolio managers.
So I’m not saying you can’t look at volatility as a way to understand the markets. You just never make it your sole determination for making a decision one way or another. Assuming you do subscribe to volatility as a measure of risk, the current market environment ranks as one of the lowest risk periods of the past forty years and could end up being the lowest volatility-adjusted cycle ever.
These are the rolling three year annualized returns on a 60/40 stock/bond portfolio comprised of the S&P 500 and the BC Aggregate Bond Index:
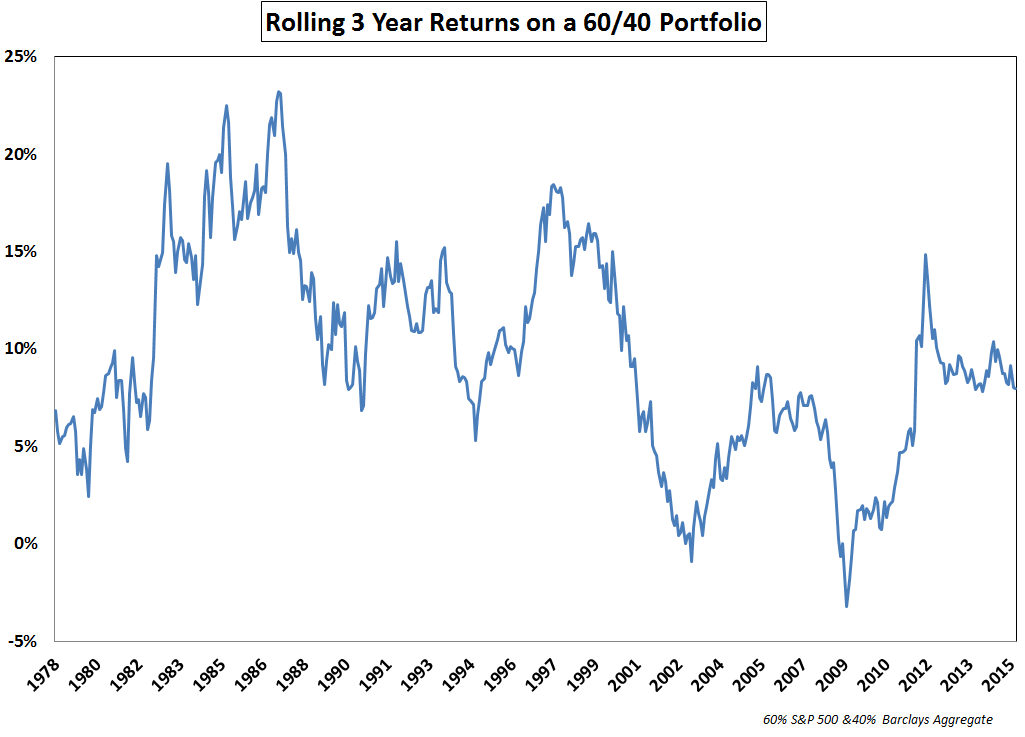
Returns on this simple portfolio have actually been fairly average over the past few years, with higher than average stock gains, but lower than average bond performance. But take a look at the risk adjusted returns using the same time frame:
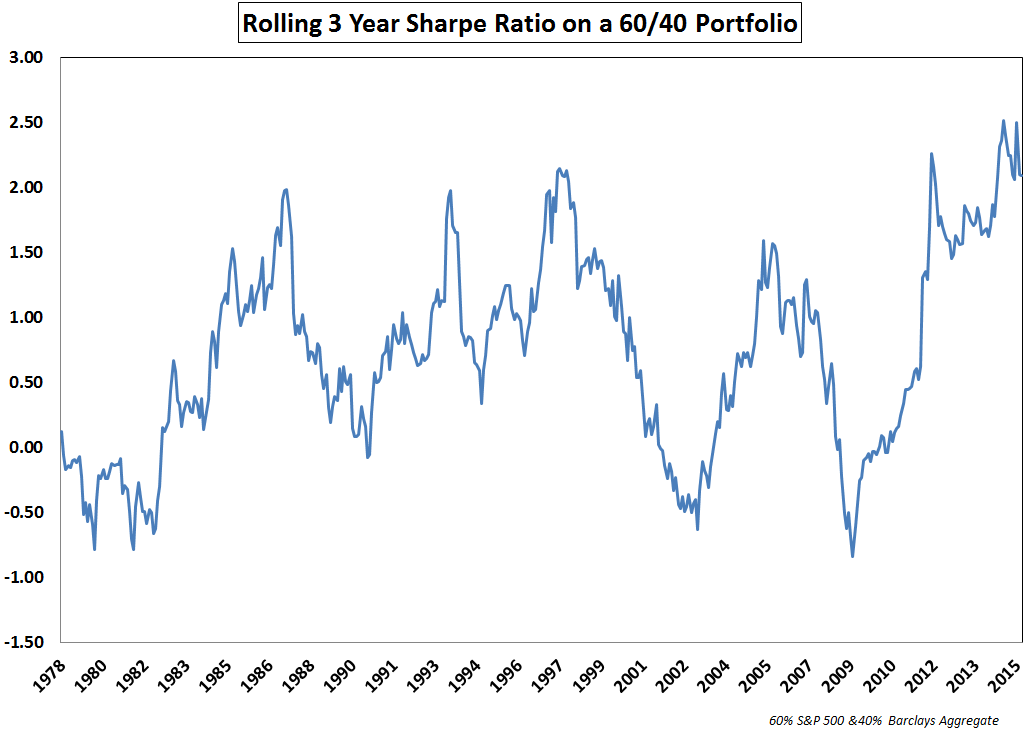
We’ve witnessed the highest Sharpe Ratios on record going back to the mid-1970s. Of course, any time volatility is used as a measure of risk, stocks are going to completely dominate that equation. Here are the three year returns for the S&P 500:
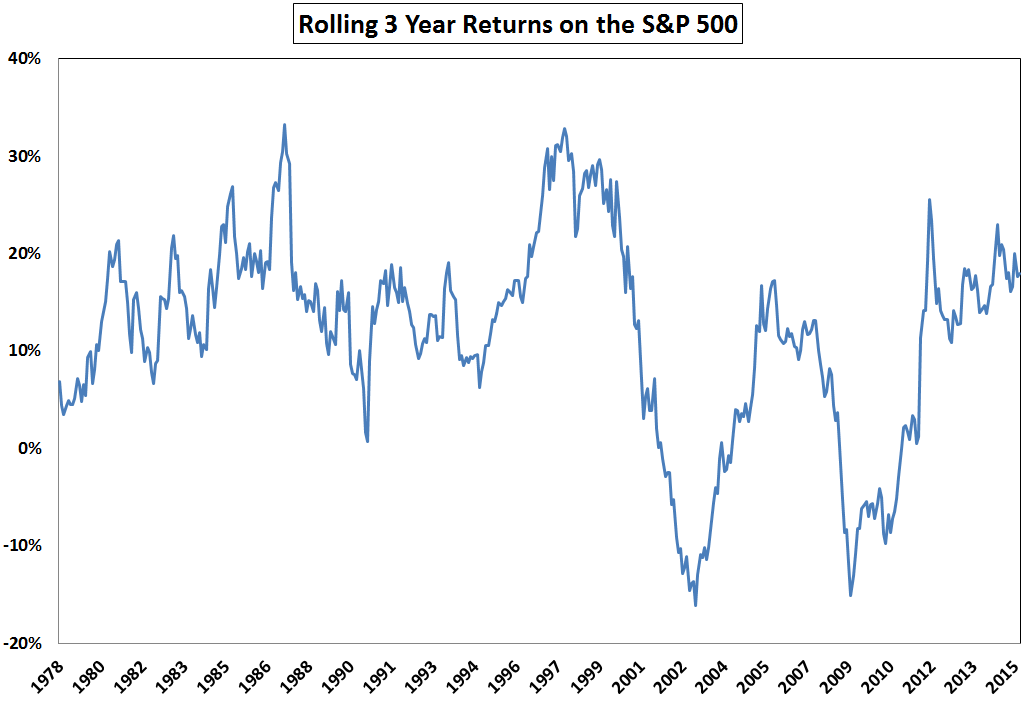
And the rolling three year Sharpe Ratio on stocks:
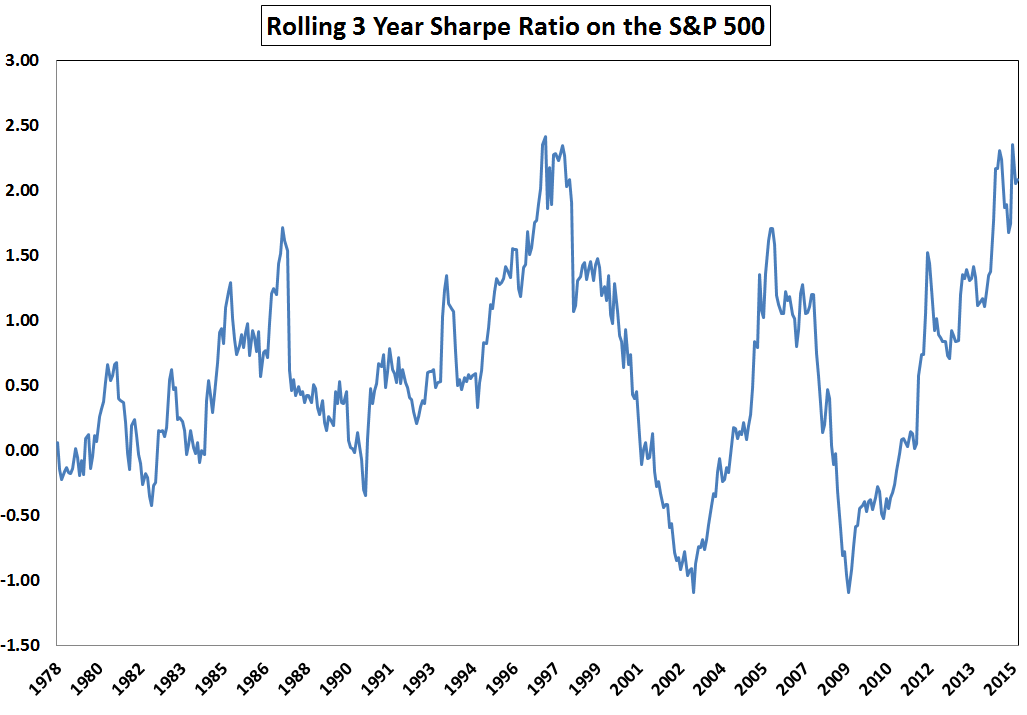
Stocks are also right around their peak Sharpe Ratio in this window of time. This makes sense in theory — we’ve had high returns, low volatility and extremely low or non-existent risk free returns. Add all of those up and you have the perfect recipe for high absolute and risk-adjusted returns.
This is actually one of the reasons I’m so skeptical of utilizing these types of risk measures. Investors could claim that is was their superior risk management abilities or investment expertise that led to such amazing risk-adjusted returns, when in fact it was all of product of the market environment. I’m not saying you should ignore volatility-based measures of performance, but they always need to be put into context. Nothing is ever as easy as it appears in a ratio.
There’s a running joke in the investment industry that everyone spends all their time researching, benchmarking to and talking about the 60/40 stock/bond mix but no one actually invests in that portfolio. There may be some truth to that statement if you consider cash, real estate and other diversified investment options. If nothing else, 60/40 provides something of a default balanced portfolio option for comparison purposes. It’s also been pretty tough to beat these past few years.
I hate the phrase “the easy money has been made,” because investing is never easy. Just go back and look at some of the headlines and fear-mongering that’s been going on during this recovery. It was never easy no matter what the data says. But if you have a U.S.-centric portfolio that’s heavily allocated to stocks and bonds it’s likely you just lived through one of the lowest risk periods ever to invest in — from a textbook perspective.
Subscribe to receive email updates and my quarterly newsletter by clicking here.
Follow me on Twitter: @awealthofcs
My new book, A Wealth of Common Sense: Why Simplicity Trumps Complexity in Any Investment Plan, is out now.
Has Einhorn Lost His Mojo?
I send out a weekly hedge fund profile with 13F stock picks and results to The Idea Farm each week. At the bottom of the post is the recent Greenlight Capital profile.
One of the big challenges with allocating to active (subjective, not quant) managers is you are betting on their process – their ability to continue to keep doing what is is they are doing, and doing it well. So how does one know when to stop following a manager? Perhaps style drift or lost enthusiasm. Resting on their laurels, or maybe a nasty divorce. Too many assets? Put in jail. Newer, younger, and hungrier managers. Lots of reasons to move on from some managers, but often the criteria can be subjective.
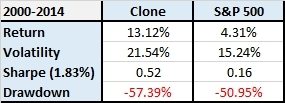
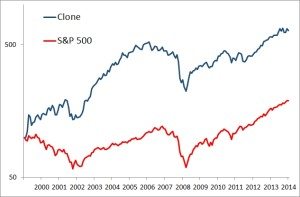
Below is an example with everyone’s favorite poker player and stock mover, David Einhorn. (Note this is only examining his long book, and the 13F one at that. Perhaps his shorts are adding value, etc.)
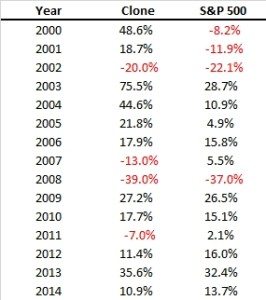
As you can see, he has absolutely crushed the market since 2000 by over 7 percentage points a year. $100k invested in his 13F long picks would be worth about $600k vs. only about $200k in the S&P 500. But his story is one that is really about two periods. 2000-2006 , and 2007-2015. From 2000 – 2006, Einhorn beat the S&P500 every single year, on average by a whopping 27% per year! Since then? On average losing to the S&P 500 by about 4% a year.
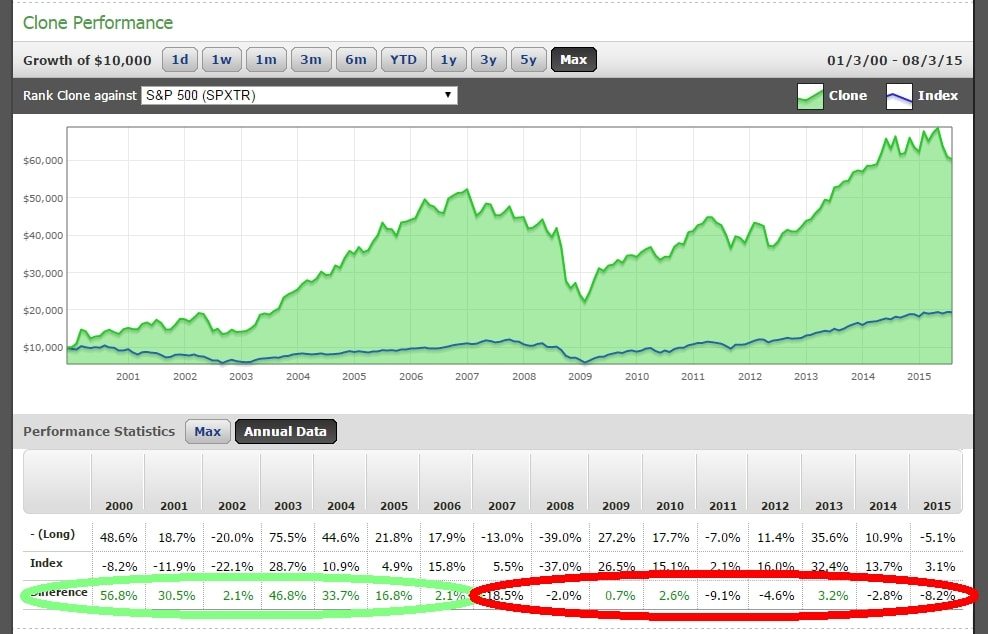
Greenlight Capital, David Einhorn
“What I like is solving the puzzles. I think that what you are dealing with here is incomplete information. You’ve got little bits of things. You have facts. You have analysis. You have numbers. You have people’s motivations. And you try to put this together into a puzzle or decode the puzzle in a way that allows you to have a way better than average opportunity to do well if you solve on the puzzle correctly, and that’s the best part of the business.”
As an ace poker player (he has won millions in high stakes tournaments and donated his take to charity), David Einhorn knows how to read the table — when to go all in on a hand he trusts and when to bet against a bluffing opponent. He plays the stock market in much the same way.
Einhorn’s multi-billion Greenlight Capital runs a concentrated portfolio heavily skewed toward his top positions, and the top six accounted for more than half of invested positions in the first quarter of 2015, according to his SEC filings. But for someone with that much money riding on companies he likes, Einhorn tends to get much more attention for the companies he hates.
An Einhorn short generates major headlines and can have the power to move a stock’s price. Companies on the receiving end of one of his short plays are said to be “Einhorned,” a term he joked about in a 2012 conference with the line, “Apparently now I’m a verb.”
He was once investigated by the SEC for market manipulation after discussing his short position against finance firm Allied Capital; his comments at a 2002 conference about his short generated so much activity in the stock that trading was temporarily suspended.
It took years to resolve, but Einhorn was eventually vindicated and the company taken to task by the SEC. Allied was subsequently bought out and taken private, and Einhorn wrote a book about the experience, Fooling Some of the People Some of the Time.
There have been a number of other high-profile campaigns against companies since then. He argued that Lehman Brothers was using suspicious accounting and overly risky practices; the company collapsed in 2008 and during the economic meltdown. He presented a 100-page attack on Green Mountain Coffee Roasters in 2012 and delivered a 66-page presentation in 2014 explaining his short against Athena Health. That presentationconcluded with a vintage line from Einhorn: “We believe that there are serious risks to this business model that are being mostly ignored by bullish investors and sell-side analysts.”
That comment belies the ferocity with which Einhorn often pursues his prey. A profile in the New York Daily News quoted an unnamed source in describing how Einhorn works: “He does deals where he rips your face off. If he had a fin, he’d be swimming in the ocean.”
While it may be uncomfortable to be on the receiving end of an Einhorn short, it can be quite profitable to place money with him. He doesn’t always come out on top, but the thesis behind each investment – long or short — is based on such deep research and intensive analysis that even other hedge fund managers are impressed. One hedge fund manager described what Einhorn does as “extraordinarily detailed work.”
A graduate of Cornell University with a degree in government, Einhorn interned with the SEC, considered joining the CIA, but wound up taking a job at investment bank Donaldson, Lufkin and Jenrette (which was later bought out by Credit Suisse). Two years later he left for a job at hedge fund Siegler Collery & Co., and in 1996 launched Greenlight with a colleague from that firm.
Greenlight has since grown from less than $1 million in assets to more than $10 billion, while Einhorn has himself become a billionaire and earned a reputation as a masterful short seller. But that reputation tends to overlook his other skill as a long investor running a highly concentrated portfolio.
Click any chart to enlarge.
FIGURE X –13F Holdings, 6/30/2015

Source: AlphaClone
FIGURE X – 13F Performance, 2000- 2014
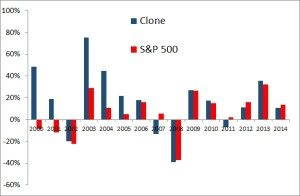
Source: AlphaClone
Julian Robertson's second dalliance with investors disappoints
For Julian Robertson, the 83-year-old billionaire former hedge fund manager, history is repeating itself.
In 2000, Robertson returned outside investors' money to focus on his own fortune. In 2010, he started taking money from outside investors again, but five years later, two of the three vehicles he set up have been unwound, while the third has shrunk as investors have pulled their money.
Robertson's personal fortune has more than doubled to $3.4 billion since 2000, and his Tiger Management is as strong as ever: the hedge funds he has ownership stakes in now manage more than $30 billion, up from about $20 billion in early 2010 and equal to highs in 2008 just before the financial crisis. But the small part of his empire devoted to outside fund management has been less successful, and he's unlikely to expand that business, people familiar with Tiger said.
Since 2000, Robertson has focused on giving start-up capital to hedge fund managers. After the financial crisis, many asset managers struggled to raise money from other investors, so Robertson decided to help raise money from outsiders for the hedge funds he had invested in. To do that, and ensure Tiger's success for the next generation, he promoted his son, Alex, to managing partner and brought in a trio of executives to help run and market the business.
He started three vehicles that in turn put money into funds he already backed. Two were essentially funds of hedge funds for state pensions in Pennsylvania and North Carolina. One, Tiger Accelerator, let investors share in Robertson's ownership stake in six firms that managed hedge funds, and invest directly in the six funds as well.
TAR HEEL PARTNERS
The North Carolina fund, created at the request of the state pension system, was called "Tiger Tar Heel Partners." It invested in two funds that Tiger had already backed: Tiger Consumer and Hound Partners, and the blended portfolio produced gains through June 2014. Tiger had hoped North Carolina would add to the $140 million it allocated in 2012, allowing Tiger Tar Heel to hire more fund managers, people familiar with the matter said.
But, in a previously undisclosed move, Tiger Tar Heel was dissolved this spring at Tiger's request. At about the same time, North Carolina decided as a matter of policy to invest directly in stock-focused hedge funds instead of through intermediaries, pension fund spokesman Schorr Johnson told Reuters. Investing in hedge funds directly can be less expensive as funds of hedge funds typically add an extra layer of cost, although Tiger did not charge such fees. Tiger indirectly benefited from having managers that it had seeded receive additional capital.
North Carolina's move followed the collapse in 2013 of Tiger Keystone Partners, a fund created at the request of the Pennsylvania State Employees' Retirement System. A small loss early on—mostly tied to a bad bullion-related bet by hedge fund Sun Valley Gold— prompted a pension board member to call for the state to get out, according to public comments reported by The Philadelphia Inquirer.
A political brouhaha ensued, and the pension's investment chief retired. The fund ultimately rebounded to a slight gain, but Tiger, frustrated with the experience, killed it, people familiar with the matter said.
STALLED ACCELERATOR
Some investors have also bailed on Tiger Accelerator, a fund launched in June 2011 that allowed outsiders to invest in six funds already seeded by Tiger. Investors were also given stakes in the companies that managed the funds, a first for Tiger Management, which previously kept those stakes for itself.
Accelerator raised $450 million, most of it with the help of Morgan Stanley's far-flung clients in its wealth management network. Investors, including the St. Andrew's School in Middletown, Delaware, and the Bowana Foundation, a charitable vehicle for the founder of Boston Market and Einstein Bros. Bagels, committed to keeping their money tied up for two years and to pay as much as a 10 percent fee on returns if the fund performed well.
In 2011 and 2012, the fund performed better than indexes of hedge funds but worse than the Standard & Poor's 500.
Some investors were disappointed by the early returns and pulled out of the fund at their first chance in 2013.
Other investors pulled out money more selectively — the fund was designed to allow them to withdraw from some Tiger Accelerator funds while remaining in others. Investors have mostly left Cascabel Management and Long Oar Global Investors, laggards that have or plan to return significant capital to investors this year, but are staying in business, according to people familiar with the situation.
Assets stood at just $295 million as of April 30 this year, down from $464 million in November 2012, according to client reporting materials.
To be sure, some funds that Tiger Accelerator invested in turned out to be winners. Nehal Chopra's Ratan Capital Management and Ben Gambill's Tiger Eye Capital both produced several years of huge returns and dramatically increased their assets.
Investors in Tiger Accelerator received returns from two sources: the investments in actual hedge funds, and their partial ownership of the companies that managed the hedge funds. About $15 million has been paid out by Accelerator to investors from those partial stakes, people familiar with the matter said.
It's not the first time Robertson has faced withdrawals from impatient clients. In the late 1990s, he lost money as he avoided Internet stocks and focused on shares he thought were undervalued. Investors got tired of waiting for him to be right, and withdrew billions of dollars. Tiger’s assets under management sank to about $6 billion from as much as $22 billion before.
Soon after he closed the fund, the air hissed out of tech stocks. But Robertson had already moved on, giving startup capital to some of his former star analysts – often around $20 million each for a 20-percent to 25-percent stake in the business.
Tiger has seeded about 50 firms overall, not to be confused with Tiger "Cubs" — pre-2000 Tiger employees who have gone on to run some of the largest hedge funds in the world.
Seeding has helped Robertson's fortune rise to $3.4 billion from about $1.5 billion in 2000, according to Forbes and the Wall Street Journal. Robertson is an active philanthropist and his non-hedge fund investments include luxury hotels and land in New Zealand, where he spends a significant part of the year.
Industry experts including David Shukis, head of global investment services at Cambridge Associates, which helps pension funds pick hedge funds and manage their holdings, said investors often love picking stocks and funds, and view working with clients as more of a chore.
"It makes sense when managers who have already made a lot of money from fees say 'I don't need to do this anymore,'" Shukis said.
How Has The 4% Rule Held Up Since The Tech Bubble And The 2008 Financial Crisis?
The 4% rule has been much maligned lately, as recent market woes of the past 15 years – from the tech crash of 2000 to the global financial crisis of 2008 – have pressured both market returns and the portfolios of retirees.
Yet a deeper look reveals that if a 2008 or even a 2000 retiree had been following the 4% rule since retirement, their portfolios would be no worse off than any of the other "terrible" historical market scenarios that created the 4% rule from retirement years like 1929, 1937, and 1966. To some extent, the portfolio of the modern retiree is buoyed by the (only) modest inflation that has been occurring in recent years, yet even after adjusting for inflation, today’s retirees are not doing any materially worse than other historical bad-market scenarios where the 4% rule worked.
Ultimately, this doesn’t necessarily mean that the coming years won’t turn out to be even worse or that the 4% rule is “sacred”, but it does emphasize just how bad the historical market returns were that created it and just how conservative the 4% rule actually is, and that recent market events like the financial crisis are not an example of the failings of the 4% rule but how robustly it succeeds!
How Conservative Is A 4% Safe Withdrawal Rate?
The origin of the 4% was to look at what kinds of withdrawal strategies would have worked through various historical scenarios (the original study analyzed a 30-year time horizon, although the same approach can be applied for a shorter or longer time horizon as well), and pick the withdrawal rate that would have succeeded (for that time horizon) in the one worst scenario in history. By definition, if a retiree went through a future retirement scenario that was as bad as anything we’ve ever seen, the retirement would still succeed (just barely), and in any other scenario, the results would just be even better.
Of course, given that most of the time, a retiree doesn’t actually turn out to retire on the eve of the next great economic catastrophe, systematically implementing spending at a 4% initial withdrawal rate will most commonly just leave a huge amount of money left over. After all, while sometimes an unfavorable return sequence may occur, in general a 4% withdrawal rate is really quite modest relative to the long-term historical average return of almost 8% on a balanced (60/40) portfolio!
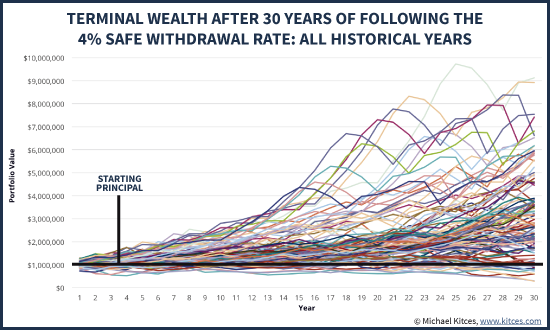
Accordingly, the chart above shows the nominal wealth path that would have occurred historically for a 60/40 portfolio with a starting balance of $1,000,000 that had a 4% initial withdrawal rate (adjusting spending each subsequent year based on inflation), going all the way back to the 1870s (using Shiller data). And as the results reveal, most of the time, the 4% rule just leaves a large amount of principal behind! Over 2/3rds of the time the retiree finishes the 30-year time horizon still having more-than-double their starting principal. The median wealth at the end – on top of the 4% rule with inflation-adjusted spending – is almost 2.8X starting principal. In other words, it's overwhelmingly more likely that retirees will have opportunities to ratchet their spending higher than a 4% rule, than ever need to spend that conservatively in the first place!
In fact, even when starting with a 4% initial withdrawal rate, less than 10% of the time does the retiree ever finish with less than the starting principal. And it has only happened four times in the ‘modern era’ of markets: for retirees who started a 30-year retirement time horizon in 1929, 1937, 1965, and 1966. In essence, then, these are the retirement years upon which the 4% rule is based; the whole reason we use the 4% rule is specifically to survive these kinds of ‘worst-case’ unfavorable-sequence-of-return scenarios we’ve seen historically.
How The 4% Rule Is Faring For 2000 And 2008 Retirees
The fact that the 4% rule is based on a particular subset of especially bad historical scenarios gives us a unique opportunity to compare recent challenging times for retirees – like those who retired in 2000 or 2008 – and see how they compare. In other words, if we looked at how the portfolio of a retiree was doing in the first half of a retirement starting in 1929, 1937, or 1966, would a retiree who started in 2000 or 2008 be doing similar, better, or worse?
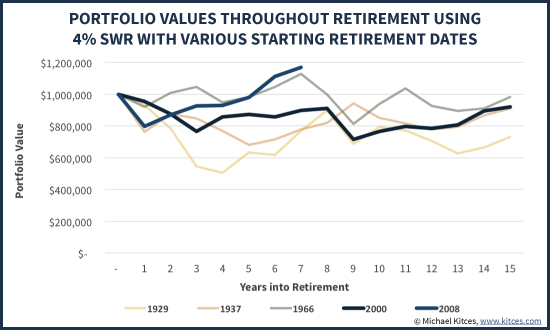
As the results reveal in the chart above, despite how shocking the tech crash and the 2008 financial crisis appeared to be in real time, the reality is that such retirees still have portfolios that are performing similar to or better than most of the historical 4% rule scenarios. The 2000 retiree is already half way through the 30-year time horizon with similar wealth to a 1929, 1937, or 1966 retiree had at this point, and the 2008 retiree is even further ahead than any of those historical scenarios (and even ahead of the 2000 retiree, too!).
Of course, an important caveat to the chart above is that it’s based on ‘nominal’ dollars, not adjusted for inflation. Which is important, because it means that retirees who had similar portfolio balances after the first half of retirement were not necessarily going to have the same buying power with those dollars for the rest of retirement (because of what inflation had been in the first half of retirement). This is especially true for the 1966 retiree, who experienced significant double-digit inflation in the first half of retirement.
Accordingly, the chart below re-calculates the progress of these retirees, based not on the nominal value of their portfolio through the first half of retirement, but based on the amount of inflation-adjusted spending they were doing from the portfolio at that halfway point. In other words, what was the retiree’s then-current withdrawal rate, year by year, as both the portfolio bounced around and inflation-adjusted spending requirements continued to rise each year.
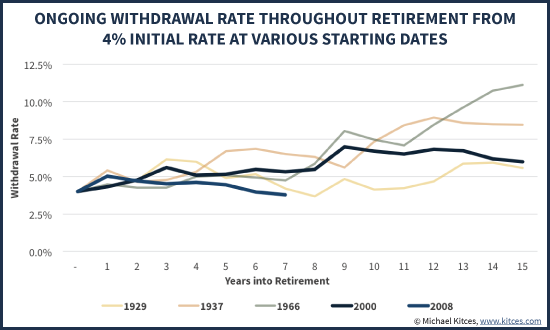
In this chart (where lower numbers are good, because it means the withdrawal rate is low and spending is modest relative to wealth), it quickly becomes clear after adjusting for the level of inflation-adjusted spending how much more severely adverse the first half of retirement was for the 1966 retiree than the others (the 1966 line is much higher than the rest). Even though the value of the portfolio was similar to the other retirements when measured half way through retirement, the current withdrawal rate at that point was far more problematic, having already spiked above 10% with 15 years still to go. In fact, the only reason the 1966 retiree was able to finish retirement at all with such a high withdrawal rate at the midpoint is that, by the half-way mark of retirement in 1981, both the stock and bond markets had gotten so cheap (yields had gotten so high) that the superior returns (and declining inflation) made it possible to finish successfully.
Relative to the 2000 or 2008 retiree, though, the results continue to look reasonably in line. Certainly the markets are not as favorably valued now for the 2000 retiree as they were in 1981 for the 1966 retiree, but then again the 2000 retiree is still only at a 6.2% withdrawal rate today (with just 15 years to go), while the 1966 retiree was over a 10% withdrawal rate at this point. And in the case of a 2008 retiree, the withdrawal rate is already right back at the 4% initial withdrawal rate the retiree began with (after already doing 6 years' worth of retirement spending!).
Keeping Retiree Market Disasters In Historical Context
Ultimately, the key point here is simply to recognize that the 2000 retiree is merely ‘in line’ with the 1929 retiree, and doing better than the rest. And the 2008 retiree – even having started with the global financial crisis out of the gate – is already doing far better than any of these historical scenarios! In other words, while the tech crash and especially the global financial crisis were scary, they still haven’t been the kind of scenarios that spell outright doom for the 4% rule.
The viability of a 2008 retiree following the 4% rule is especially notable, and reflects a key (but often ignored or misunderstood) tenet of managing sequence-of-return risk in retirement: it’s actually not just about having a severe market crash in the early years of retirement, but a crash that doesn’t recover quickly. Or more generally, the reality of sequence-of-return risk is that it’s more about having a mediocre decade’s worth of returns, not just a sharp single-year decline that goes through a similarly sharp recovery. And since the markets in the aftermath of 2008 have not stayed down and in fact have been more like a V-shaped recovery (as the S&P 500 has rocketed upwards to now be more than triple its value from the March 2009 trough), it turns out the 2008 financial crisis was an example of something that is not a dangerous sequence-of-returns event after all!
Of course, it’s also notable that while the 2000 and 2008 retirees are equal to or ahead of their respective historical-worst-case counterparts, the currently high valuation of the markets (based on Shiller P/E ratios) along with today’s low bond yields mean that those portfolios may be more stressed going forward from here. Still, though, these 2000 and 2008 scenarios are facing greater headwinds from what is otherwise still a lower withdrawal base than most of the other comparable bad-sequence historical scenarios. In other words, even if market returns are worse going forward from here than the bad market scenarios that safe withdrawal rates are based upon, the portfolios of today’s 2000 and 2008 retirees may still be more than far enough ahead to survive the 30-year time horizon anyway. It simply means they’ll be additional examples of scenarios that didn’t leave much at the end of a 30-year retirement, but not necessarily ones that breach the 4% rule in the first place.
Arguably, the case of the 2000 retiree is perhaps somewhat concerning, given a 6.2% current withdrawal rate for what is still a 15-year retirement time horizon (as a 65-year-old couple in 2000 would be turning 80 this year) built on a base of currently high market valuations and currently low yields. It wouldn’t be surprising to me to see the year-2000 retiree end out pushing the limits of the 4% rule, given that market valuations were stratospheric at the time, even relative to historical standards. Still, the current 6.2% withdrawal rate of that year-2000 retiree today is actually modest enough that a retiree couple in such a scenario could simply take the remainder of their portfolio, and buy a joint and survivor single premium immediate annuity with inflation-adjusting payments. At current market rates, the inflation-adjusting payout for the 80-year-old couple (assuming the 65-year-old retirees are now 15 years into retirement) would be 6.5% for their joint lives, more than enough to cover their 6.2% spending rate. Which means even the 2000 retiree isn’t yet below the ‘critical threshold’ that couldn’t simply be guaranteed for life, if depletion was a concern. In addition, a growing base of research suggests that retiree spending in real dollars tends to decline in later years – i.e., spending increases for retirees in their 70s and 80s don’t even keep pace with inflation – which means in practice a 2000 retiree today is probably even better off and spending even less as a current withdrawal rate than these calculations would suggest.
The bottom line, though, is simply to recognize that even market scenarios like the tech crash in 2000 or the financial crisis of 2008 are not ones that will likely breach the 4% safe withdrawal rate, but merely examples of bad market declines for which the 4% rule was created. In turn, this is an implicit acknowledgement of just how conservative the 4% rule actually is, and how horrible the historical market returns really were that created it. In the end, this doesn’t necessarily mean that the 4% rule is ‘sacred’ and that some future market disaster couldn’t be bad enough to undermine it (and of course, it can/should still be adopted for individual circumstances like a longer/shorter time horizon, the impact of taxes, the impact of fees and other investment costs, etc.). But when the Great Depression and the stagflationary 1970s couldn’t break it, and the crash of 1987 and even the global financial crisis of 2008 were just speed bumps, it will take a lot to set a new safe withdrawal rate below 4%!
Subscribe to:
Posts (Atom)
Lunch is for wimps

It's not a question of enough, pal. It's a zero sum game, somebody wins, somebody loses. Money itself isn't lost or made, it's simply transferred from one perception to another.