Friday, October 31, 2008

Veryan Allen Responds to BudFox Email - Writes a new post

Hedge fund drawdown?

Risk management Rule No.1: if it can happen then it will happen. Hope for the best but plan for the worst. Recent events have provided good returns for some hedge funds, hard times for other hedge funds but harsher times for long only. Skilled absolute return managers don't make money every month but they do have milder and shorter duration drawdowns than index funds. I wrote back in January that the Dow and Nikkei would likely fall below 10,000 this year as a result of the credit crisis and owning stock index option puts has indeed been the top performing strategy this year. But those were just lucky guesses. I can't time markets so personally I'll be focusing on funds that can preserve capital, control drawdowns and generate alpha no matter what happens.

Flight to quality? Some REAL hedge funds are POSITIVE for the year even when the aggregate returns for the industry are negative. Performance dispersion is enormous in such a diverse universe. Several strategies have NOT been affected by prime brokers imploding, changes in short selling rules or the leverage lockdown. The BEST managed futures CTAs, global macro, high frequency quantitative and options trading strategies have been generating absolute returns throughout the equity and credit mayhem. Strategy diversification is so important since forecasting is difficult, especially about the future. Transitions from one market regime to another often requires a financial revolution.

Crash or capitulation? Dislocated markets create inefficiencies for traders with the rare expertise to exploit them. For anyone predicting a Great Depression, it is worth recalling that hedge fund managers Benjamin Graham, John Maynard Keynes, Karl Karsten, Philip Fisher and Gerald Loeb performed well in the 1930s. And when the 1960s boom ended, even the Buffett Partnership closed down despite good performance but Warren has extracted plenty of alpha subsequently. Similar to some other prominent multistrategy hedge funds, Berkshire Hathaway is down over 25% this year but I have no doubt managers with genuine edges will be back at high water marks before equity benchmarks. Sure there are issues affecting particular strategies but the best managers are able to adapt, learn and ultimately thrive in changed conditions.

Hedge funds are dead. Long live hedge funds. I am long/short optimistic/pessimistic for different strategies. Even in the best conditions only 10% of hedge funds are "buys" and 90% are "sells". If we lose the bottom quartile or two, it will be POSITIVE for the industry. Survival of the fittest. The crowd is usually wrong and seeking alpha requires going against the crowd. Severe losses for stock markets have occurred many times in the past. Plenty of "hedge funds" unable to manage risk or cope with chaos disappeared in 1970, 1974, 1994 and 1998. The more funds that shut down, the better the opportunity set for skilled managers. Economists forecasting the end of hedge funds (again!) should look into how much money was made by people who invested IN hedge funds at the end of 1998 or 1994. Most long biased funds closed as a result of the hard times for hedge funds in 1969 but that had no impact on REAL hedge funds that didn't need a bull market to make money.

Creative destruction is a feature of free markets and there have been several hedge fund shakeouts previously. I don't know the etiology of the market meltdown and credit crisis or speculate on future economic policy initiatives or regulatory solutions. I do know good hedge fund managers are able to evolve in WHATEVER market conditions occur. When business magazines use words like hedge fund extinction, absolute return armageddon or hedge fund apocalypse then capitulation is near. All I can say in response is that out of the hedge funds that I follow, they range from UP a lot to DOWN but much less than long only equity funds.

The FUTURE prospects are negative for some strategies BUT the outlook is attractive for many other strategies. The manager universe is so varied and investment skill so wide ranging that the "average" return is not very informative. Of course the "typical" manager will be down especially with the largest hedge fund category being long biased equity. The independence of a return source and the low covariance of that performance with underlying risk factors is what separates the alpha managers from the beta pack. Keep the powder dry since buying good securities and good hedge funds in a drawdown can turn out to be a good idea.

Alpha is good but leveraged beta is not. Turbulence and turmoil permit talented traders to make money. The PURPOSE of REAL hedge funds is to REDUCE total portfolio volatility. The previous bear period a few years ago when stock markets dropped 50%, money flowed INTO hedge funds for that very reason. Quality hedge funds offer a SMOOTHER ride, lower volatility and less severe drawdowns than long only. Despite the hysteria, the percentage asset allocation to absolute return strategies has actually RISEN this month because more has been lost in the stock market. When a strategy gets too crowded it can make sense to do the opposite. Shorting that "upward drift" of equities and reverse arbitrage have worked well this year.

Markets fluctuate. The revenge of the pessimists has triumphed over the optimists recently. Hedging means expecting and preparing for the unexpected. Reduce risk and PROPERLY diversify BEFORE bad times occur. The beta bubble has burst so the need INCREASES for absolute return strategies that can make money or preserve capital in difficult times. Many equity or credit risk premium funds masquerading as hedge funds have been revealed. Thorough due diligence can detect such bull market reliance in advance. If a fund needs fine conditions to make money there is little point in having it in the portfolio. We can get "good economy" return sources from traditional funds. A real hedge fund should offer something different.

Some might be content to "ride out" another steep stock market drawdown but I don't bet on beta myself. I prefer finding managers with skill at risk management and security selection. Absolute returns from volatile times requires a rare talent with a robust strategy. The pundits could note that some very SOPHISTICATED investors are planning to INCREASE hedge fund allocation in 2009 because they recognize the alpha opportunities that will be available. Most redemptions from losing hedge funds will simply be reinvested in better strategies run by superior managers. If anything the equity and credit meltdown PROVES the case for bona fide alpha generators. Neither hedge funds nor capitalism are facing judgment day. Recent economic eschatology has been misinformed and counterproductive.

Capital should flow to quality strategies as much as quality assets. A properly diversified portfolio can eliminate major drawdowns. Volatility is vicious if a manager is not nimble or too constrained to capture the market anomalies it creates. Commentators try to impose a homogeneity on hedge funds but it is the heterogeneity of strategies and managers that is the value proposition. A good fund below its high water mark is an opportunity but a good manager up for the year is even better. Natural selection and thorough research reveals who those funds are.

I've never found empirical evidence for the "equity risk premium" but "skill-based alpha" is persistent in the hedge fund performance data. The "average" hedge fund has lost money but would anyone seriously expect an AVERAGE fund manager to have made money this year? Recent events PROVE the rarity of skill and the case for strategies that can protect capital in DOWN markets. Alpha is the ability to extract absolute returns out of other market participants. 2 and 20 is worth paying for uncorrelated sources of return but not to funds that need conducive markets and risk premia to make money.

Great depression - no, great delusion - yes. In bull markets the best trade is usually to short sell arrogance and ignorance of risk but in bear markets it can be optimal to buy into pessimism and negativity. With the widespread predictions of depression, we are likely near the end of the panic. Ironically my own long term macro model just switched to bullish after 18 months of bearishness. The beauty of computational intelligence is that it is the complete opposite of computational finance. The caveats are that the black box can be early and the markets could still fall further. An edge does not mean correct all the time. But since it has been short stock indices and long volatility for such an extended period the risk/reward MIGHT now favor the bull case. Not that I have ever invested in a long only equity fund; there are so many arbitrages and mispricings available instead.

Some good hedge funds made money while others have had limited drawdowns during the market meltdown. Many have reduced exposures and moved substantially to cash. A bear market for stocks and credit is the SCENARIO that proves the need for proper diversification. Of course beta dependent unskilled funds are shutting down and being redeemed but that is the Darwinian feature of the business. In contrast quality hedge funds are functioning as a portfolio hedge during difficult times for traditional assets. Despite the temporary problems, top hedge funds will likely offer good long term prospects for risk-adjusted absolute returns. That was true 1929-2008 and I would be pretty confident of similar for 2009-2088.

Thursday, October 30, 2008

Overnight Libor At Lowest Level In Years

As a sign that the credit crisis has eased significantly for the time being, Overnight Libor has dropped to its lowest levels in years to 0.73125%. After spiking to 6.43% at a time when the Fed Funds Rate was at 2% on September 16th, and then spiking to 5.09% again on October 9th, O/N Libor is now below the 1% Fed Funds Rate. Let's hope it stays that way!

Onlibor

Fedfundsminuslibor

Jim Stack: Market historian calls 'imminent' bottom

Written before yesterday's sharp rise, stock market historian and advisor Jim Stack had forecast an "imminent bottom" for the market. A long-term timer, he is not looking for quick pops and drops; rather, the "safety-first" money manager focuses on slowing positioning his portfolio for long-term, secular trends.

Indeed, in his InvesTech Market Analyst he was among the few to accurately forecast the current crisis; over the prior year and a half, he predicated both the bust of the housing bubble and the derivatives-based meltdown that would result.

After maintaining a defensive, cash-heavy portfolio during the market's downturn, he is now becoming more optimistic, noting, "All of our bearish extremes readings that precede the best stock buy opportunities are now in place."

Stack explains, "How can we put this bear market in historical perspective? No doubt about it, this bear market is a whopper – both in size and severity.

"With a 42.5% loss in the S&P 500 Index, it is rapidly closing in on the big bear markets of 1973-74 and 2000-02. In fact, no bear market in the past 70 years has declined over 50%.

"In severity, this bear has unfolded much faster than past bear markets, wiping out $6.7 trillion in stock values in barely 12 months – equivalent to over 90% of the loss in the 2000-02 bear market in two-fifths of the time

"In measuring impact on investors' portfolios, this bear has 'repossessed' more than 84% of the prior 5-year bull market gains! Both the DJIA and S&P 500 Index are back to price levels seen over 10 years ago in 1998.

"Why has the stock market decline turned so precipitous in the last few weeks? In bigger bear markets, investors always end up throwing out the baby with the bath water.

"That typically occurs once bear losses reach an extreme that many investors feel they just can't hold on anymore. In the current case, a lot of the broad-based selling is coming from 'forced redemptions' by hedge funds.

"These supposedly safe investments are losing money, and the high net worth individuals that qualify to invest in them are abandoning hedge funds in record numbers – with a record $43 billion in hedge fund withdrawals in September alone. We can be sure it's been a lot higher in the past couple weeks.

"What is the strongest evidence that the bear market is nearing an end? Increasing evidence points to investor 'throwing in the towel' type of capitulation: the highest number in over 56 years of available exchange data!

"Past extremes at similar levels occurred on May 29, 1962 (74%), August 29, 1966 (56%), May 26, 1970 (58%), and October 20, 1987 (57%) – all were either at, or within weeks of, the final bear market bottom.

"Readings such as we've seen usually coincide with temporary, if not longer-term, market bottoms – even during protracted bear markets like 2000-2002.

"Of the 10 most extreme historical 'Pressure Factor' readings prior to 2008, every one saw the stock market higher six months later – and the majority by double-digit gains.

"One reason investor fears are so high is because the current risks are so intangible. Most investors don't even know what a derivative or a CDO (Collateralized Debt Obligation) is, let alone who owns them, or what the consequences are in the event of default.

"Yet everyone's ready to panic when they suddenly hear that 'credit markets are seizing up.' To some extent, this borders on nuttiness.

"Not that the current mortgage debt and derivative problems aren't serious and require massive government intervention. But the sky is not falling, and the financial world is not coming to an end.

"At this point, we believe a market bottom is imminent or perhaps already in place, but volatility is likely to continue with the market retesting its lows."

InvestorLetterPalooza Day I

As threatened yesterday, the first 10. So let’s start with some famous last words.

Above all, we will survive because, unlike the fallen, our portfolios do not consist of great piles of manure, bought as if it were gold. If we own some manure, here or there, and we always do because we bought it on purpose, as the fine manure it is, and at bargain prices — for manure. It is not for nothing we live in farm country.

Hedge Fund Alert reported Oct. 22 that Whitebox Advisors had suspended redemptions, after Goldman Sachs doubled its collateral demands on the firm’s convertibles portfolio.

by Andrew J. Redleaf
The Whitebox Advisor Sep. 30 2008

Moving right along, a shotgun blast for Hank & Ben:

This response to our own financial crisis seems dramatic and startling. In actuality, it is long overdue and is not a result of any creative thought. It is certainly a socialistic cure, however, one that was needed at this point in the crisis. The absurdity of the situation is that it took us so long to get here. The IMF has analyzed banking crises around the world and their position could be summarized in 10 simple steps to follow in such a crisis...

...Unfortunately, it appears that the government has failed to properly implement one critical step.

by Thomas J. Barrack Jr
Colony Capital Oct. 14 2008

Barrack’s letter names TPG’s David Bonderman as “the best and the brightest investor in the world.” You know where this is going.

In order to diversify the risk of the Washington Mutual investment, TPG's $1.35 billion commitment was split across three funds — $475 million to TPG V, $475 million to TPG VI and $400 million to TPG Financial Partners, a co-investment vehicle targeted at financial services opportunities...

...Unfortunately, the chaos and uncertainty of the financial and housing crises has led to the addition of Washington Mutual to the growing list of unsuccessful financial institution investments.

by TPG Team
TPG Capital Sep. 25 2008

Meanwhile, elsewhere in Texas, betcha! McCain/Palin weren’t the only Republican Mavericks having a rough September.

Maverick’s quarterly letters have always started with a brief sentence reviewing the strength or weakness of the previous quarter. Unfortunately, I cannot find words to describe our disappointment, embarrassment and shock over the above results. As you might suspect, in the past quarter our results were horrible in every sector and region in which we invest (although our returns in healthcare and emerging markets were arguably only disappointing.)

by Lee S. Ainslie III, Managing Partner
Maverick Capital Oct. 9 2008

Looking for scapegoats? Pretty much everywhere, in case you wondered.

Perhaps most sadly, our country and the system that has brought the world so much prosperity is in danger of becoming discredited. Years of excess, enabled by spineless and economically ignorant politicians, weak-kneed regulators, greedy investment bankers, and an acquiescent and shortsighted populace have backed our country into a corner where we may uncomfortably find ourselves for some time.

by Seth Klarman
Baupost Group Oct. 10 2008

We interrupt this narrative for a cheery, uplifting history lesson.

This banking crisis hit the US in the fall of 1873. Railroad companies tumbled first. They had crafted complex financial instruments that promised a fixed return, although few understood the underlying object that was guaranteed to investors in case of default. (Answer: nothing). The bonds had sold well at first...The panic continued for more than four years in the US and for nearly six years in Europe.

by Scott Reynolds Nelson
The Chronicle of Higher Education

It had to be in here somewhere. The negativity is overwhelming. Values are compelling. Prudent investors with a long term horizon...

In the third stage of a bear market, on the other hand, everyone agrees things can only get worse. The risk in that – in terms of opportunity costs, or forgone profits – is equally clear. There’s no doubt in my mind that the bear market reached the third stage last week. That doesn’t mean it can’t decline further, or that a bull market’s about to start. But it does mean the negatives are on the table, optimism is thoroughlylacking, and the greater long-term risk probably lies in not investing.

The excesses, mistakes and foolishness of the 2003-2007 upward leg of the cycle were the greatest I’ve ever witnessed. So has been the resulting panic.

by Howard Marks
Oaktree Capital Management Oct. 17 2008

Oh, we tease because we love. What we really love, however, are people call Barnyard Epithet on Avuncular of Omaha (especially when they start out by saying they “wholeheartedly respect” their elders...and then misspell the name in question).

While I wholeheartedly respect my elders, Mr. Buffet’s (sic) comments today in the NY Times worry me. I am going to both agree and respectfully disagree with him. The disagreement is fundamentally based upon timing...If you bought stocks in mid 1929, you didn’t get back to EVEN until 1954!

I wonder how much money Mr. Buffett will cost people with his Op-Ed piece today?

by J. Kyle Bass
Hayman Advisors LP Oct. 17 2008

And sometimes, even getting small wasn’t small enough.

Our third quarter performance was down 6.13% and we are down 9.32% year to date. We are disappointed with our recent performance, particularly since we have been reducing our overall equity exposure and building liquidity for over twelve months in anticipation of a global credit crisis. Given our concerns about the macro environment, we entered September with the least amount of directional market exposure we have had in the last few years. Our cash balances also increased significantly, rising from 26% at the end of August to 31% by the end of September, one of the highest levels the firm has ever held.

Until the last ten days of September, the fund’s performance held up relatively well...

Third Quarter Review Oct. 8 2008

Meanwhile, this guy is probably a relation of Peter; while the long-term record looks like the sort of respectability achieved by concentrated long positions, that very nearly 50 percent thumpage in Q3:2008 shows what always happens to concentrated longs, in the fullness of time. But, silver linings are always good.

We probably won’t have to pay any capital gains taxes this year. If Contango had been sold in September, as planned, we would have had huge long-term capital gains this year and would have to pay a lot of taxes as a result. At this point, it doesn’t look like we’ll have much, if any, realized capital gains in 2008.

by Mark A. Sellers III
Sellers Capital LLC Oct 14 2008

A Tsunami Is Coming, But Is It Deflation Or Inflation?

There is an tsunami about to make landfall on the US economy. But will it be inflation or deflation? On the one hand we have deflation propelled by the crushing of commodity markets: oil, gas, gold, etc… as well as the massive real estate implosion across the globe.

On the other hand, consider all the inflationary agents:

  • loose US monetary policy the discount rate (as expected) being lowered to 1%
  • a loose fiscal policy (in an assumed Obama Biden administration)
  • a $1 trillion financial bailout
  • IMF bailouts of countries such as Iceland, Pakistan, etc.
  • loose monetary policy for all major central banks of the world

To muddy the waters even more, the US dollar has shot up to 2004 levels. Most would argue that a stronger dollar is deflationary. So amid all these cross currents, what can we expect as the net result? I’m not smart enough to wade through all the econometric data so I’ll let the market do that for me.

To get an idea of what the market thinks inflation will be we can look at the difference between the 10 year nominal treasury bonds and TIPS (Treasury Inflation-Protected Securities) which pay a real rate of interest. The difference between them is the forward implied inflation:

tips inflation expectations long term chart october 2008

For most of 2008 it estimated inflation at 3% but suddenly at the beginning of this month, it went into free fall. As of October 28th, 2009 it stood at -0.2945%. The bond market is clearly expecting the deflationary pressures to win over and win big.

The previous lows on the chart are for June 1998 and February 2001 when the estimate for inflation was 1.44%. Obviously we are in uncharted territory. Something that everyone is used to by now, no matter what metric or indicator we’re talking about. Looking back, in 1998 the Federal reserve reduced the Fed Funds rate from 5.50% to 4.75% by year end. And in 2001, the Fed slashed rates from 6.00% to 1.75%.

The difference with our current scenario is that the Fed had already started reducing rates. The Fed Funds rate was 5.25% way back in mid 2006 so at 1.00% where we currently stand, we are very late in the game. But they don’t have much choice since the other option is deflation.

We could even see the Fed turning Japanese and going for a zero or near zero interest rate. That possibility is more than plausible especially since the Fed’s wording hinted to their readiness to keep cutting. Japan amazingly avoided runaway inflation when they took their rates down to zero from 2001 to 2006.

If only the Fed had listened when the bond market was screaming for a rate cut back in 2007.

Stop Being Bearish

Face it…you missed the bearish call. You are down 40 percent.

Even if we drop 20 more percent tomorrow, you missed the call. The call was to get out last September and not look back.

Now what?

I get twenty calls a day from friends down 30-50 percent in crap (yes if it’s down 50 percent it’s crap and your manager knows squat) asking me what they should do. That’s the way the money business works. Nobody calls their own manager who lost them the money. That’s because their manager wrote them a letter blaming Greenspan, Paulson, Bush, Goldman…..

Listen up. If your manager is down 50 percent fire him…NOW (you should fire yourself, but you won’t). Even if you give it to another manager down 50 percent it will be cathartic. Tell him he sucks b--ls as well. Ten times.

There is no use talking about the past right now. All rear view bulls-t. Won’t make you back a nickel.

All that matters is what’s next.

My answer….I wish I knew.

What I do know is…I don’t think it pays to listen to CNBC, Cramer, The Octabox, Art Cashen. Sure Cramer nailed the short side for an hour, but it does not count because he was yelling fire in a crowded room. He missed the call by 4,000 Dow points. Art Cashen would still be looking for a washout at Dow 1,000. He is long ago senile from having a microphone jammed in his face by that other yutz on the floor at CNBC. It’s all rather sickening.

Grab yourself by the socks and man up. You will not make back your losses in 2 years or 3 so deal with it.

Investing is hard. It is a priviledge, not a right. Borrowing was supposed to be a priviledge too, but YOU abused it. Capital one just sold it.

Lot’s of innocent people are getting hurt. It’s called collateral damage. It’s called LIFE. Life is difficult.

Take a look at this fantastic chart created by my friend Colin who runs internet research at Canaccord

canaccord.jpg

Odds matter to me.

Betting on the end of the world at this point seems fun and exciting. COMFORTABLE even. Just not a bet for me anymore. You know where I stand…light, flexible and ‘too small to fail’.

Nikkei Up 26% Since Tuesday

With three straight days of gains (that's right, gains!), Japan's Nikkei 225 Index is up 26% since Tuesday. The current three-day run is the strongest since 1970. But even after this monstrous rally, the Nikkei is still 3% below the level it closed at nine days ago, and since the start of the second half, it is still down 33.0%.

Nikkei

HEDGER PAULSON BETTING ON OIL, NATURAL GAS

Hedge fund superstar John Paulson seems to be building his stake in beaten-down energy companies.

Paulson's firm raised its position in Cheniere Energy, which develops liquefied natural gas terminals, by 2.7 million shares recently, according to a filing with the Securities and Exchange Commission. This makes the hedge fund mogul the second-largest owner with a stake of 14.6 percent.

Whether Paulson sees good things for energy stocks or just sees a cheap stock is unclear. He didn't return a request for comment and has been super-secretive about his strategy.

Paulson, who runs the $35 billion Paulson & Co., became famous for pocketing as much as $3 billion last year on bets against subprime mortgages. Now he's being glorified further for keeping it up even as the industry founders.

So far this year, his six funds are posting returns of between 5 percent and 25 percent.

Sources tell The Post, Paulson's largely avoided the energy trades that hurt so many of his peers when oil prices whipsawed from $150 a barrel to close to $60 in a matter of months. He's also been shorting banking stocks.

His latest filings with the SEC suggest that despite avoiding oil bets, he sees opportunity in energy stocks.

His quarterly stock ownership filing with the SEC in August showed his firm added two new energy stocks to the portfolio, including his first bets in Cheniere Energy.

At the time, he already owned shares of offshore drilling company Hercules Offshore and electricity company Mirant. In addition to buying 4.7 million shares of Cheniere, he purchased 1.9 million shares of W-H Energy Services, which provides drilling products and services.

It could also be a simple value play. Cheniere's stock has fallen to all-time lows, hitting 95 cents a share earlier this month, down from close to $42 a share late last year.

Wednesday, October 29, 2008

Joke of the Day: The Stock Market

Today's Joke of the Day is an intraday chart of the Dow Jones Industrial Average. After trading up nearly 300 points, the Dow had a 400-point reversal from 3:47 to 4:00 PM. Some are attributing the late-day decline to an announcement from GE CEO Jeff Immelt that he aims for flat 2009 earnings, but could that really cause such a move? Especially since GE's contribution to the reversal amounted to a mere 6 points of the Dow's decline. Prior to this month, one could only think of a few events that would send the market down this much this fast. However, after what we've all experienced over the last few weeks, today's action is just par for the course.

Djia1029

S&P 500 Earnings vs. Valuation Matrix

Even though we're in the midst of earnings season, most investors really have no idea where earnings are going to be in the future. While the consensus forecast for 2009 is currently around $95, there probably isn't a person on the planet who thinks earnings will be anywhere near that high. But how much further below $95 will earnings be, and what multiple do those earnings deserve?

With that in mind, we created a matrix to show where the S&P 500 would trade based on different combinations of earnings and multiples. Boxes highlighted in red indicate levels within 5% of where the S&P 500 is currently trading. As shown, if (and we realize there is really no chance of this happening) the consensus for 2009 EPS forecasts proves to be accurate, the S&P would currently be trading at about 10 times next year's earnings.

So where are earnings likely to come in next year? One of the more bearish forecasts making the rounds is that earnings for the S&P 500 will come in at $60 per share next year. If that forecast proves to be accurate, that would bring the current multiple of the S&P 500 to about 15.5 times next year's earnings. While a multiple of 15 is by no means extremely cheap on a historical basis, it is hardly expensive either.

Earnings Valuation Matrix

Is the Fear Bubble Bursting?

There have been quite a few bubbles and mini-bubbles that have burst over the past year or so. A short list would probably include China; housing; oil; fertilizer; solar; dry bulk carriers; etc.

What about a fear bubble?

We have overshot on just about everything else, so maybe it’s time we overshot the whole business of overshooting. Fear and volatility have become so much a part of the everyday existence for those who work in the investment world that it is all too easy to take them for granted.

When I see a contract on Intrade that allows people to bet on the end of western civilization, then I’ll know things have gone too far. I haven’t seen such a contract yet, but I feel obliged to note that there is a contract for The U.S. Economy to go into a Depression in 2009, with a depression defined as “a cumulative decline in GDP of more than 10.0% over four consecutive quarters.”

Looking at previous bubbles, I wonder if the fear bubble is analogous to an oil bubble. You see macroeconomic events moving inexorably in the same direction day after day and you begin to assume the future is a predestined march down what looks like an unavoidable path.

On Monday, in Fear Is on the Decline, I talked about signs I was seeing that fear was already “starting to leave the markets.” The VIX has already fallen more than 15% from Monday’s close and there is a good chance it will be at least another decade before it sees the 80s again.

Roger Ehrenberg is out with another thoughtful piece, Is Volatility Embedded in the System for a Generation? In it, Roger paints a picture of a financial crisis receding only to the point that it exposes gaping fundamental holes in the economy, the substantial risk of a Japan-style deflation, and a Fed so determined to prevent deflation that their easy money policy leads to runaway inflation and ultimately some sort of cruel game of low growth inflation-deflation ping pong.

In such an environment, which I would not consider to be too far-fetched, Roger describes a VIX of 40 as the new 20 and predicts a much higher floor for volatility in the future.

On the other hand, I am reminded of a post I titled The Big Question for the VIX back on May 22nd when the VIX closed at 18.05. The big question back then, with a financial crisis raging, oil approaching 150, and investor anxiety on the increase, was why the VIX was below 20.

Just five months ago, which was the more unlikely scenario: crude oil at 60 or the VIX at 90? It’s hard to say, but suffice it to say that it would have been hard to find the appropriate strikes to even make such a bet back then.

In the last five months, cause and effect has flipped. Not too long ago it was oil prices that were driving estimates of future economic activity and volatility, now the economy is the cause and oil, volatility and the like are the effects.

One day of 900 points gains in the Dow Jones Industrial Average will not fix all the economic woes on the horizon. It just might, however, signal an end to the runaway bull market in fear.

Give my regards to 85 Broad

“High conviction” Masters of the Universe sale

Goldman Sachs Dynamic Opportunities Limited (“GSDO”) is a Guernsey registered closed-ended, fund of hedge funds which is listed and traded on the main market of the London Stock Exchange (“LSE”). GSDO launched in July 2006 and was the first closed-ended, exchange listed investment company managed by Goldman Sachs. GSDO represented the largest initial public offering of a fund of hedge funds listed on the LSE up to that point. GSDO is managed by Goldman Sachs Hedge Fund Strategies LLC (“HFS” [or Commodities Corp. to its really old friends]) which has 38 years of experience in allocating to alternative investment strategies. GSDO invests in a concentrated portfolio of high conviction managers. GSDO allocates to both core strategies such as relative value, event driven, tactical trading and equity long/short strategies as well as other niche strategies.

A 12-month chart for GSDO, the GBP-denominated (and largest, with its £182 million market cap accounting for about 75 per cent of the pool at Oct. 27) share class:

GSDO_Price
Click image for detailed view

And, for your edification, a 12-month view of the NAV premium-discount:

GSDO_NAV
Click image for detailed view


As someone very wise once said, in bear markets they come for everybody sooner or later. And who might they be coming for? Allocations at Dec. 31 2007, the latest date for which information seems to be available, including the 0.14 per cent holding in Amaranth International Ltd (good choice):

Managers
Click image for detailed view

More sordid details here. (US readers encountering the disclaimer page should feel free to lie to the pretend compliance qualifiers. I did.)

Thanks Simon, for the hedzzup and the screen grabs.

Tuesday, October 28, 2008

We now know investing like Yale isn’t easy


By Len Costa

Published: October 28 2008 03:29 | Last updated: October 28 2008 03:29

When financial institutions teeter, liquidity is in short supply and correlations between asset classes converge in unexpected ways, even sophisticated investors can be forgiven for questioning some of the fundamental tenets of money management.

“Our protection is supposed to be diversification,” said one member of the Institute for Private Investors, a peer networking organisation for ultra-wealthy families, during a recent IPI meeting in New York. “It didn’t protect, and it feels awful.”

A key, differentiating feature of the global credit shock is that it originated in the world’s most advanced financial system. As Martin Wolf recently pointed out in his column, this is a problem of complexity, not backwardness.

Complexity also turns out to be a key feature of private investor portfolios: illiquid and opaque alternative managers – largely hedge funds, but also private equity, venture capital, real estate and commodities funds – today account for 46 per cent of the average IPI member’s portfolio, up from 28 per cent in 1999.

Unfortunately, portfolios laden with alternative investments have in many cases not performed.

Martin Leibowitz, managing director of research at Morgan Stanley, examined the risk and return characteristics of a hypothetical endowment model portfolio with a 40 per cent allocation to alternatives between 2003 and 2007. Although the portfolio outperformed a traditional one with 60 per cent in stocks and 40 per cent in bonds, he discovered that it did not materially reduce volatility. In fact, the performance of US equities explained 94 per cent of the endowment portfolio’s overall return.

Mr Leibowitz found similar results between 1993 and 2007, and also discovered evidence that both strong and weak equity markets reduced the relative return of the hypothetical endowment portfolio.

This is unexpected. Over the past decade, the shift into alternatives was inspired in large part by the stunning record of David Swensen, chief investment officer for Yale University. His treatise, Pioneering Portfolio Management, published in 2000, opened many private investors’ eyes to the power of alternatives.

Now, investors are grappling with the fact that investing like Yale isn’t easy. A good many hedge funds, it seems, were not truly hedged. And, as the past few months have shown, risking substantial illiquidity in the quest for outperformance can come at a high cost. In addition, most private investors cannot count on the advantage enjoyed by top endowments: the sizeable cash inflows from alumni and donors, which add to total return over long periods. As Jim McDonald, president and chief executive of Rockefeller & Co, says, major ongoing streams of contributions enable top endowments to tap illiquid investments earlier, stay in them longer and tolerate losses with greater fortitude.

Endowments also enjoy unparalleled access to top-tier funds and are tax-exempt organisations. Conversely, private investors typically pay taxes on their hedge fund investments, may not have access to the top managers, and therefore need to scale a higher hurdle to realise value.

According to an analysis by one IPI member, private investors seeking a target pre-tax return of 10 per cent would need the typical hedge fund to return 14.5 per cent and typical fund of funds to return 17.1 per cent just to overcome the fee burden.

In a survey of IPI members completed last week, more than three quarters of respondents said that “few” to “none” of their absolute return managers have produced positive returns in this down market.

Even so, wealthy investors are not about to abandon hedge funds – or the endowment model – whole-scale. According to the IPI survey, roughly half of respondents plan to hold their hedge fund, private equity, and real estate investments steady.

Some investors and advisers are happy with the performance of their alternative investments and are increasing their allocations.

Mark Green, chief investment officer at Oxford Financial Group, says the absolute return hedge funds recommended by his company have helped his clients reduce volatility during this turbulent time. He expects investing with hedge funds to become less burdensome.

“Investors are going to have more leverage over their managers than they have had in some time.”

Investors and advisers would do well to keep an eye on opportunities outside of the alternatives space. With many traditional asset classes now beaten down to attractive levels, boring once again looks beautiful.

How ‘Wall Street’ Sequel Tripped on Reality


Stephen Schiff isn’t a trader or a banker, but he knows first-hand about the convulsions on Wall Street. He is the screenwriter who wrote was was supposed to be Gordon Gekko’s long-awaited comeback vehicle — only to have the landscape of Wall Street ripped up and rearranged in the months after his final draft was turned in.
“I’m certain my former masters at Fox will find a way to make a Wall Street sequel for a planet on which Wall Street has ceased to exist, and I wish them every success,” Mr. Schiff wrote on a post in The Daily Beast.

In the meantime, he said, he has been left wondering about all the predictions he heard from Wall Streeters during his research for the movie — predictions that, by and large, were completely off the mark.

As he traveled from New York to London to Dubai, speaking with people who were plugged into high finance, it seemed that one topic dominated the conversation, Mr. Schiff wrote: “Bankers wanted to talk about hedge funds. Oligarchs wanted to talk about hedge funds. Journalists wanted to talk about hedge funds.”

There was an obsession with these secretive investment pools, which seemed to have a license to print money, as well as the expensive-art-buying, mansion-building people who ran them.

Fast forward to October: Many of the most prominent hedge fund managers are sounding downright humble, apologizing to wealthy investors for double-digit losses at their flagship funds. Not exactly the Hollywood image of a high-flying hedge fund guru.

As for the question of what might cause the next Big Meltdown on Wall Street, Mr. Schiff said the people he interviewed once again missed the big story. Many suggested terrorists or China were the most serious threats, but reality deviated from that script.

Mr. Schiff wrote:

The funny thing is, not one of them mentioned the crash in housing prices. Not one mentioned subprime mortgages or mortgage-backed securities. No one imagined Bear Stearns going under, or Lehman Brothers, or AIG. No one foresaw banks Like WaMu and Wachovia crumbling.

The Largest Company in the World...Volkswagen

Yes Volkswagen! As just another example of how crazy things have become in this market, in terms of market capitalization, Volkswagen temporarily surpassed ExxonMobil (XOM) and became the largest company in the world this morning. The reason for today's move is due to an announcement from Porsche that they intend to increase their stake in the company to 75%. Since Volkswagen had the highest short interest of any stock in the German DAX index (12.9% of float), the result was the mother of all short squeezes. After closing at 210 Euros on Friday, Volkswagen rose above 1,000 Euros in intraday trading and is currently trading at 643 Euros.

Today's move in Volkswagen highlights the complete lack of liquidity in the marketplace these days. When the largest companies in the world are making triple-digit percentage moves on a regular basis, it's hard to say that the market is operating in a rational manner. Although holders of Volkswagen are probably feeling pretty good right now!

Volks

Monday, October 27, 2008

Risk Management and Hooke's Law


John P. Hussman, Ph.D.

Though I continue to view stocks as reasonably undervalued, I'm a bit concerned that so many investors appear to be looking for a bottom. The S&P 500 currently reflects the best valuations since the 1990 bear market low. Even in the event of a continued bear market, stocks are increasingly likely to experience a powerful bear market advance, perhaps on the order of 20-25% toward the 1100 area on the S&P 500. However, we've observed little follow-through from the early price/volume improvements of a week ago, suggesting that even while traders are attempting to catch a potential rally, they are demonstrating little commitment to whatever purchases they are making in this area.

We aren't trying to catch a rally – we are gradually building an investment exposure based on valuations. Our investment response to undervaluation is straightforward: we establish investment exposure in proportion to the return/risk profile that we can expect from prevailing conditions, on average. At the 2002-2003 lows, stocks never got to the point of undervaluation, so we remained fully hedged until we observed a shift to favorable market action in the spring of 2003, at which point we quickly removed 70% of our hedges. In a market that has become undervalued, however, the strategy of waiting for a measurable improvement in market action historically has not performed nearly as well as a strategy of gradually increasing market exposure, on declines, as the market's valuation improves. Scaling in that way is certainly not comfortable, but the willingness to experience short-term discomfort is a scarce and ultimately well-compensated resource on Wall Street. The key is to scale gradually and in proportion to the expected return profile, rather than trying to “time” reversals that can't be predicted.

My sense is that many traders are willing to establish some exposure to market risk here, but they've also got a finger hovering over the sell button. So while they are holding onto long positions, their commitment is extremely tentative. If the market was to substantially break below, say, the 800 level on the S&P 500, I suspect that many traders would hit that button. That's not investing – that's trying to “play” the market.

So traders may try to “catch the lows” if the S&P 500 drops to the 830 area again, but I would expect that subsequent failure into the 700's could send those same traders, as well as skittish investors, rushing to sell at any price. The increasing chatter about “trading a rally” rather than “investing for value” makes me suspect that we shouldn't rule out a decline into the 700's, where I expect value-oriented investors to take a firmer stand. As noted below, we have to allow for both an immediate rebound, as well as a substantially larger decline. Within that range, we should observe reasonably strong support about 9% below current levels (an educated guess which we don't rely on and neither should you), which would bring the cumulative loss in the S&P 500 from last year's peak to about 48%.

Sorry for the splash of cold water, but my view is that the market is undervalued, that it is priced to deliver attractive long-term returns, and that there is an increasing likelihood of a major bear market advance – but I don't believe that any of this puts a “floor” below the market in the very short term, and I don't believe markets are apt to bottom while everyone is still looking for a bottom.

As an economist, it's clear that the parallels to 1929 are terribly overblown, not least because unlike the Great Depression, governments in this instance have opened a floodgate of liquidity, capital and base money – which they failed to do back then. Even if we were to completely zero out two solid years of earnings for the S&P 500, the fact is that more than 90% of the value of U.S. stocks would reside in the cash flows beyond that point. The main issue for good, established companies here is not the risk to the long-term stream of cash flows, but to what extent the uncertainty about the coming year or two of earnings will frighten investors to sell at depressed prices (thereby pricing stocks to deliver even higher long-term returns).

Profit margins did achieve higher levels in the past cycle than I would expect on a sustained long-term basis, but that observation is already factored into our analysis of valuation. We're always open to evidence that would change our analysis of very long-term growth prospects for the U.S. economy, but that evidence evolves slowly enough that we could easily see another complete bull-bear cycle in the interim. We don't follow a purely quantitative or mechanical investment approach, so context does matter, but we generally don't assume that the regularities (if not laws) of economics and finance have been entirely suspended. One of those laws is that a stock is a claim on a very long-term stream of future cash flows, and very little of the value is attributable to the first year or two. Market crashes are invariably about risk premiums, not long-term cash flows.

In the Strategic Growth Fund, we've got put option coverage below nearly all of our stock holdings, but we are not short the corresponding call options. As a result, we certainly expect some impact from local market fluctuations (both positive and negative), but expect to have a muted sensitivity to any major breakdown. Our put option defenses do not defend against movements of a few percent, but are in place to protect against unacceptably large downside risk in the event of severe additional market losses. At the same time, shareholders can expect that we will gradually reduce the extent of our put option coverage in the event that the market does decline significantly more.

Risk management and Hooke's Law

Successful long-term investors set investment positions that are consistent with their tolerance for risk, they expect periodic losses, and they tend to increase their investment exposure gradually as the market declines significantly. Last week, Warren Buffett didn't say “I'm all in because I think this is the bottom.” Rather, he said “If prices keep looking attractive, my non-Berkshire net worth will soon be 100 percent in United States equities.” That phrase implies that Buffett knows his own risk tolerance, and that he is scaling into stocks gradually as their prices decline and their expected long-term returns increase.

There's a general relationship in physics called Hooke's Law, which applies to springs: “as the extension, so the force.” My impression is that the stock market behaves much the same way. When investors are very skittish, the market may behave like a very loose rubber band, generating little tension even as it moves significantly away from fair value. But as risk aversion abates, the tension becomes much more like a stiff spring, and the potential to return forcefully toward normal valuations becomes enormous, particularly when the distance from fair value is large.

[Geek's Note: Adding up the cumulative tension described by Hooke's Law gives you a measure of the “potential energy” stored in the spring, which is proportional not to the distance the spring is pulled, but to the square of that distance. This observation has a nice analogy to finance, in terms of how investors should scale into a falling market. Taking the basic dividend discount model as an example, if the growth rate is 6% and the initial yield is 3%, it takes a 25% drop to increase long-term returns from 9% to 10%. From there it takes another 20% drop (40% cumulative) to increase long-term returns to 11%. From there, it takes a drop of 16.7% (50% cumulative) to increase long-term returns to 12%.]

Generally speaking, it takes smaller and smaller price declines to produce the same increment to expected returns, suggesting that investors should initially scale slowly, but accelerate their scaling as prices decline substantially.

The way investors do violence to their financial security is to establish an investment position outside of their actual tolerance for risk, believing they can manage that risk by panicking to sell if the market drops lower. As prices drop, poor investors set an ultimatum for the market by saying, “If this thing loses one more dime, I'm out.” Invariably, the thing will lose that dime and the the investor will get out near the bottom, having taken most of the losses, but abandoning any prospect for recovery and subsequent growth.

The time for fear is when stocks are strenuously overvalued. The time for panic is when they are overvalued and market internals begin to deteriorate. We are now beyond the time for fear, and beyond the time for panic. Still, we are not yet to the point for aggressive investment positions. Rather, we are at the point where investors should be gradually increasing their exposure, open to the possibility that stocks could decline still lower. If they do, long-term investors should cheer, because lower prices will mean better long-term return prospects, and will be an opportunity to increase investment positions further.

Keep in mind that the Strategic Growth Fund has been hedged in recent years because stocks have been priced to deliver disappointingly low long-term returns. That fact has now changed, and we are carefully and gradually changing our investment exposures accordingly. Still, it is important to contemplate the possibility of unexpected market outcomes, by avoiding investment positions that have a risk of intolerable losses if prices move against us.

An intolerable loss, in my view, is one that requires a heroic recovery simply to break even. A fully invested position in the S&P 500 has already experienced what I view as an intolerable loss, because the 43% loss from the high now requires a 75% gain just to break even. In contrast, a short-term loss of 20%, particularly after the market has become severely depressed, should not be at all intolerable to long-term investors because such losses are generally reversed in the first few months of an advance (or even a powerful bear market rally). As for the Strategic Growth Fund, we've experienced a 13.9% decline from the record high set a few weeks ago, which is uncomfortable, but can be reversed relatively easily. Long-term investors in the Fund should hope for a terrifying market plunge (I know I do), which would allow us to establish a more aggressive position in anticipation of very strong subsequent returns, though at the cost of some further short-term losses as we scale into that position. Short-term traders in the Fund should, as always, go somewhere else.

Trough Valuations in Bear Markets

The fact is that we can't rule out even extreme possibilities, such as a further drop in the S&P 500 by 30% to the 600 level. I absolutely do not expect the market to fall that much (particularly not in a single, uncorrected decline), but I can still tell you what we'll probably be doing if it does. At that point, I would expect to build up to a net investment exposure of at least 80%, without put option protection on that exposure, even if no aspects of market internals were favorable. I would view that allocation as conservative in view of those conditions. You can't manage risk effectively without contemplating extreme outcomes.

Still, even if this bear market is ultimately headed for a P/E of 7, a single one-way decline, uncorrected by a major rally, is extremely unlikely. Currently, the S&P 500 has declined by about 43% on a closing basis. In 1973-74, the market halted its overall decline at about 48%. Likewise in 1929, the market halted its initial decline at 48%, at which point stocks embarked on an advance of nearly 50% over the next 6 months before weakening again. Fear-mongerers like to point to the Great Depression, saying that an investor selling at the low in 1929 would have continued to lose until 1932, but they generally ignore the huge intermittent advances, and the fact that information accumulates slowly. Even in the worst of times, steep market declines tend to produce enormous (if ultimately impermanent) recoveries, as we saw even in the Depression.

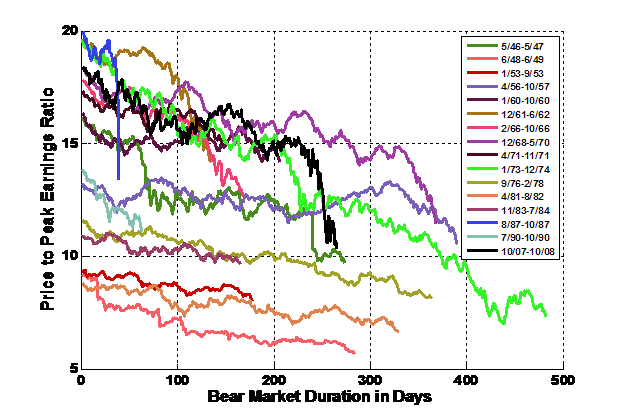
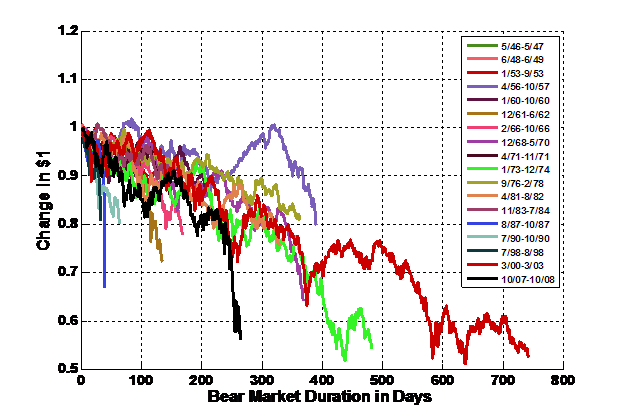
To offer some additional context, Bill Hester put together the following charts. The first shows the extent and duration of every post-war bear market. The black line is the current decline, updated through Friday. Note that the worst of these were the 1973-74 bear and the 2000-2003 bear, both which terminated with losses of about 48%. Again, this is about the same loss as stocks experienced into their 1929 low, after which the market advanced by about 50% in the next 6 months.

The second chart is equally important. It shows the overall compression of the S&P 500 price-to-peak-earnings multiple in each of those post-war bear markets. Bill's main point here is that with the exception of the 1973-1974 bear market, the downturns that ended at single-digit price-to-peak earnings multiples also started at below-average multiples. Moreover, the 1973-74 case is something of an anomaly because S&P 500 earnings actually grew by over 50% during that bear market. On the basis of the highest level of earnings at the 1972 market peak, the 1974 bear market trough occurred at a P/E multiple of about 10. Currently, the S&P 500 trades at about 10.3 times the level of earnings observed last year. None of this provides any assurance that the market could not fall substantially further in this instance, but it should provide some context in which to interpret the size of the decline that has already occurred.

So just as we should allow for downside potential, we should also contemplate the potential for upside recovery. Even if the S&P 500 was to breach, say, the 600 level, investors should recognize that they would then have a long-term investment opportunity similar to the 1949, 1953, 1974 and 1982 lows. The only reason the S&P 500 hitting 600 would be harmful to a long-term investor is if that investor was to abandon stocks there. Investors sell at the lows because they forget the tendency of deeply oversold markets to recover, but the evidence is clear, time after time, that selling after extreme one-way declines is a poor decision.

As usual, we are adhering to our investment discipline, conscious of both potential risk as well as the increasing prospects for strong returns. It is important that shareholders recognize that the Strategic Growth Fund is a risk-managed, equity growth fund, not a market neutral fund and not a bear fund. Our intent remains to outperform the S&P 500 over the complete market cycle, with smaller periodic losses than passive “buy and hold” investors would experience in the stock market. This intent is not consistent with minimizing or avoiding every risk, particularly as valuations and expected return prospects improve.

I generally don't make much of the fact that nearly everything I have is invested in the Strategic Growth Fund and the Strategic Total Return Fund, but it may help to know that all of the decisions that affect the investments of my shareholders also directly affect my own investments. Given present market conditions, shareholders can be certain that I will continue to take an even-handed approach to both the risks and potential returns of the markets. As always, I am grateful for your trust.

Market Climate

As of last week, the Market Climate for stocks remained characterized by favorable valuations, and tentative market action – still unfavorable but with early evidence of improvement in market internals and pressures on risk premiums. As I noted last week, we are balancing the improvement in valuations and in some of our early measures of market action against our tolerance for risk. For that reason, we continue to have nearly all of our stock holdings defended with put option coverage. Part of that coverage is in-the-money, part is near-the-money, and part is out-of-the-money. This coverage will tend to mute our exposure to significant market losses, but not necessarily to small local movements of a few percent. In the event that the market declines significantly, we will gradually reduce the extent of our put option coverage as valuations improve further.

In bonds, the Market Climate last week was characterized by unfavorable yield levels and moderately favorable yield pressures. The wide credit spreads of recent months will almost certainly help to suppress inflation reports as the year continues. However, my impression is that the liquidation in commodities and inflation-protected securities overstates this inflation effect and instead reflects a great deal of forced selling on the part of hedge funds. Treasury Inflation Protected Securities have spiked to real yields of 3% and higher even at longer maturities.

Given the enormous expansion of government liabilities we are observing worldwide, it is unlikely that we will observe a long-term absence of inflation once the recent drop in monetary velocity abates. “Monetary velocity” declines when investors hoard government liabilities as safe havens – this suppresses inflation pressures by supporting the value of government liabilities, including currency. But velocity can also shoot higher once credit fears subside. So one of the casualties of easing credit fears is likely to be weakness in the U.S. dollar, and a concurrent strengthening in commodities – particularly precious metals, which serve as a currency substitute. Given the pricing of precious metals shares here, it would not be unexpected to see the XAU roughly double within the next 12 months from these levels.

The Strategic Total Return Fund moved the bulk of its assets from short-term Treasury securities to Treasury inflation protected securities as real yields on these securities surged well over 3%. We have avoided TIPS of short maturity that are selling at significant premiums to par. Despite their high real yields, the premiums over face value would erode in the event of deflation (though the securities do not mature at less than par in any event). The Fund also has about 30% of assets invested in securities outside of the fixed income area, primarily precious metals shares, foreign currencies, and utilities. We currently view all of these alternative assets as significantly undervalued here.

New and Existing Home Sales Charts


Existing and New Home Sales were released over the last two trading days, and below we highlight ten year charts of each housing indicator. Investors might have something to be excited about with Existing Home Sales since last month it broke above the miserable range it had been in for more than a year. But even though New Home Sales were slightly higher than the prior month, its chart still looks horrible, and it's definitely nothing to get bullish over.

Exisths

Newhome

What should we do?

The Dow is down 40% since its all-time high set on Thursday, October 9, 2007 and the NASDAQ is down 45% its 52-week high set on Wednesday, October 31, 2007. The NASDAQ’s all-time high was set on March 10th, 2000 at 5132.52; a 69%+ decline calculated using Friday’s close of 1,552.03.

So, what should we do?

That’s the question everyone seems to be asking.

A number of people have e-mailed me, sent me messages on Facebook or have asked me in person what I am doing or what they should do. It’s not a simple answer because everyone’s goal is different and the road each of us takes will vary. So, the best way for me to answer this question is to tell you what I am doing.

Let’s start at the automatic investments: 401(k) or IRA. Both my wife and I have these accounts and we will continue to fund them, especially with employer matches (why not – it’s free money). For example, my company matches 100% of the first 3% and then 50% of the next two percent. That’s a 5-to-4 ratio for the first 5% of my salary or in other words, I get an 80% return on the first 5% I add to my account without making a move (profit sharing is another perk that gets added to this account as well).

For example, a $100,000 salary would get $4,000 added by the employer for the first 5% or $5,000 invested into that 401(k). I suggest that anyone that doesn’t currently participate in a plan that offers a match is not making a great decision (in my opinion). Enroll and start making “automatic” deposits into the account; every year wasted is a year you lose out on an employer match and more importantly, the power of compounding. I don’t think this is the best option to grow wealth but it’s not bad when you get a match.

What about my individual stock investing account?

First, I always run to my personal library of “yellow highlighted” stock market books in times of extreme pessimism or extreme optimism. Why, because I can pick the brains of men and women who have gone through similar situations and learn from their experiences. In particular, I read Martin Zweig, Jesse Livermore, William O’Neil, Gerald Loeb and Victor Sperandeo (see reading list for details). I’ll also glance at pieces written by Warren Buffett and Peter Lynch for fundamental pointers.

Benjamin Franklin once said: “The things which hurt, instruct” - so pay attention to the indicators mentioned below and be disciplined and flexible, poor market speculators are never flexible and rarely follow the tape. It seems that every indicator is hurting big time so listen to what they are saying.

Let’s get started: I am analyzing my stock screens every week (nightly when possible). I am trying to understand the flow of the market, I’m looking for market leaders and industry groups that may want to take the lead when a bull market does decide to begin. Bull markets (up-trending markets) begin when one or more of the major indices are up at least 3% and then have a follow-through 4-10 days later with similar action. This is the first parameter we must look for.

Next, I will borrow a few techniques from Martin Zweig: I am closely watching the Advance/Decline Indicator, the Up Volume Indicator and his Four Percent Model Indicator. Definitions are below:

Advance/Decline Indicator

Advance/Decline measures the ratio of rising stocks to falling stocks on - in Zweig’s examples - the NYSE. It excludes stocks whose price does not change. If 2000 stocks rise and 500 stocks fall, the A/D ratio would be 4. Zweig uses the example of the rare event of a 10 day A/D ratio of two or more (2-to-1). If you had invested in the market as a whole each time this has happened, in the following 6 months, your investment would have risen by an average of 19 percent.

Up Volume Indicator

Up Volume is the total number of shares whose price rises. On the NYSE, the daily volume runs into billions of shares. Zweig has found that when 90 percent of the volume (excluding volume in shares whose price has not changed) is upward (9-to-1 ratio), significant upward momentum in the market is likely.

Four Percent Model Indicator

The Four Percent Model Indicator uses the Value Line Composite Index (Recently, I use the Value Line Arithmetic Index (EOD) or symbol $VLE on StockCharts.com), which can be found on the web or in financial pages of newspapers. The model makes use of the weekly close of the Value Line Index. A buy signal is generated when the index rises four percent or more from the previous week. Similarly, a sell signal is indicated when the index falls four percent or more from the previous week.

I am paying attention to Zweig’s indications as well as the New High - New Low Ratio (NH-NL), the general action among the major indices (mentioned above) and the market leaders. Other charts of interest that suggest a buying opportunity is now is the percentage of S&P 500 stocks above their 50-ma. and the percentage of Nasdaq stocks above their 200-d m.a. which is at its lowest level since it started to be tracked by my software.

My next blog post will focus on the stocks/ industries that have the strongest relative strength and best values according to my screens.

For a raging bull market (up-trending market), you need falling interest rates, probably an economic recession, lots of cash on the sidelines, good values in the market-namely, low price/earnings ratios, and a great deal of pessimism because it means there’s an abundance of cash. - Martin Zweig – We currently have all of these conditions.

“One of the frustrating things for people who miss the first rally in a bull market is that they wait for the big correction and it never comes. The market just keeps climbing and climbing. It feeds on itself in frenzied fashion and propels prices considerably higher for six months or so, and sometimes longer.” - Martin Zweig

Hang in there, no one truly knows when the carnage will end but historic opportunities are setting up right in front of our very eyes. I may be a little early but I will definitely be prepared.

“Buy when blood is running in the streets” - Baron Rothschild
“I long ago realized that the stock market is never obvious. It is designed to fool most of the people, most of the time” – Jesse Livermore

Let’s nail this sucker together!


Time To Abandon Buy And Hold? No: Time To Buy

|

Japan's 26-year low will shake the conventional investing wisdom to its crumbling foundation. Investing for the long term is one thing. Investing for a long-term that might have to defined as "many decades" is another.

We are not aware of any other developed country stock market that has traded at less than one-fifth of its peak value after 26 years. We hope we never see one again. To put that in a horribly familar context, the equivalent in our market would be DOW 2,800 in 2034.

So should you abandon that tried-and-true investment mantra, buy-and-hold? No. But you should absolutely note that, yet again, the price at which you buy is the single most reliable factor in your long-term return.

Specifically, what are the lessons here?

1. Valuation matters. We are big believers in the advantages of low-cost index investing. Most active traders underperform the market, and the ones who don't are hard to identify consistently in advance. For a couple of centuries, however, stock prices have gravitated around a relatively consistent mean (15X cyclically adjusted earnings in the US). Investors who have ignored this mean regression or rationalized it away have gotten slammed. This is true at both extremes: low valuations and high valuations.

2. Odds are good that this is a major buying global opportunity. As crazy as it feels, the time to start overweighting equities is now, when they are below their historical trend. As we noted last week, stocks still aren't screamingly cheap: After previous bubbles of this magnitude, they have collapsed to below 50% of trend value, which, for US stocks, would be about 5,000 on the DOW (read more here). Unless we are Japan, however, the current prices should provide a compelling long-term return. And, again, the very effectively disguised good news about Japan is that it is so unusual. Japan also peaked at a valuation level that we believe is unprecedented for a major market (including, thankfully, our own).

The Japan news is profound and disturbing, but it does not change the basic equation: price matters. Buy stocks when they are cheap, sell them when they are expensive. For the first time in a couple of decades, stocks are now relatively cheap (US, developed markets, emerging). Now is not the time to abandon a disciplined long-term investment plan.

Below: A chart of US stock values (through March) on cyclically adjusted earnings. They have since, finally, for the first time in more than 15 years, regressed beyond the mean--into undervalued territory. (More on this chart here)

smithersCAPEandQ2.JPG

N.B.: Some readers seem to think this or other similar posts we've run lately is a "bottom" call. It isn't. As I've said repeatedly, I find the arguments that stocks could drop much farther compelling (see the Grantham link below). I have no idea when or where the market will bottom. Based on a couple of centuries of mean-reversion, I am now more confident that stocks will produce a reasonably long-term return. ("More confident." Not "certain.")

See Also:
Grantham: Stocks Could Drop Another 50%, But Still Time To Buy
Buffett: I'm Buying Now, You Should, Too

WSJ to Warren Buffett: "Time to Get a New Crystal Ball"

Warren Buffett: Bad Timing?
Warren Buffett has gotten greedy too quickly while everyone else takes too long to become fearful, suggests the Wall Street Journal in today's "Heard on the Street" column.

Under the headline Even the Oracle Didn't Time It Perfectly, Peter Eavis writes that while Buffett has won "plaudits for some canny deals," there's also an "unnerving pattern emerging."

"Mr. Buffett looks to be committing his capital too early. On some bets, waiting might have gotten him better terms or more attractive entry prices."

"Time for the Oracle to get a new crystal ball," according to Eavis.

He acknowledges that Buffett doesn't try to time his investments too closely, and says he's not launching a "cheap gibe" based on the S&P's 7 percent decline since Buffett's 'I'm Buying U.S. Stocks' op-ed piece in the New York Times on October 17.

Instead, Eavis focuses on two bets Berkshire Hathaway has placed on derivatives.

In one, Berkshire received large payments to provide default protection for "certain junk-rated corporations" in North America. The company has already booked hundreds of millions of dollars in mark-to-market losses on its exposure to these credit default swaps. "Berkshire more than doubled it notional exposure on these CDS to $8.8 billion between the end of 2006 and the middle of this year."

Eavis predicts, "Given the deterioration in the credit markets, the third quarter hit on them could be large."

Berkshire Portfolio

(Mark-to-market means the contracts are valued at what they would sell for in the current marketplace, even though Berkshire isn't selling them now. Those mark-to-market losses remain theoretical unless and until the contracts are actually sold or there's a default, but they still must be reported as losses in Berkshire's quarterly earnings reports.)

Berkshire's other growing derivatives bet involves very long-term options that will become profitable if four stock indexes around the world go higher over a period of years. Eavis notes that Berkshire added to its positions last year and into the first half of this year. Again, Buffett expects they'll make a lot of money eventually, but right now they're not much all that much.

Eavis argues that the trades suggest Buffett "was relatively comfortable about the prospects for U.S. corporations and global stocks at a time when some were predicting a bust."

While there may indeed be long-term profits, Eavis writes that Buffett has tied up money that could be have used for trades that would generate larger profits more quickly.

MORE DOUBTS ABOUT THE ORACLE

While the Journal is a high-profile skeptic, there's are other Buffett-doubters out there, especially when it comes to his public call to buy U.S. stocks now.

A common theme is that as a billionaire, Buffett can afford to put his money down now and wait for the profits, which could be years away. The rest of us have more pressing problems.

In the Times of London, Jennifer Hill argues that Buffett Is Wrong: The Market Madness Is Still Far From Over.

In Canada, the National Post's Diane Francis echoes the sentiment with Buffett Is Wrong: Avoid Stocks.

On Seeking Alpha, Brian Keith Anderson lists 5 Reasons to Ignore Buffett and C.S. Jefferson asks "What If Warren Buffett Is Wrong About the Markets?"

Omaha Oracle: Kass Wins
There are also defenders, of course, including the often pessimistic Doug Kass, who made a profitable short-term bet against Berkshire Hathaway's stock price this year.

The key question, as it often is when talking about Warren Buffett and his famously long-term view of things, is whether an investor sees enough future pleasure to overcome pain in the present.

Buffett's investing record suggests we should be looking very carefully.

Lunch is for wimps

Lunch is for wimps
It's not a question of enough, pal. It's a zero sum game, somebody wins, somebody loses. Money itself isn't lost or made, it's simply transferred from one perception to another.