Sunday, November 30, 2008

Chart of the Week: Yields on U.S. 10-Year Treasury Notes Below 3%

The chart of the week looks like it will now be a regular feature in this space. This week’s theme, once again, has a bond focus and extends the flight to safety theme from last week. The graphic below captures the full 46 year history of the yield on the 10-Year U.S. Treasury Note. While difficult to discern from the graph, this is the first week the yield on that bond has ever closed below 3.0%. The reason for the low yield is the overwhelming demand cause by investors who are embracing a flight to safety approach to investing and see U.S. government debt as a safe haven for their assets.

The low yields on U.S. government debt have several interesting implications. One implication is that a falling VIX does not reflect the action in the government bond markets. Another implication is that rising yields will indicate when money is starting to flow out of safe haven investments toward higher risk investments such as stocks. Finally, when the bulk of those currently holding government debt decide that it is appropriate to redeploy these assets into stocks, the pent-up demand for equities will be a formidable factor to reckon with.

Saturday, November 29, 2008

Best and Worst S&P 500 Stocks Since the 11/20 Close

The S&P 500 is now up 19.11% on a closing basis since last Thursday. Below we highlight the best performing stocks in the index since then, along with the five stocks that are down.

Best112

Down112

Friday, November 28, 2008

Locking in low gas prices

With all the malaise in the stock market, a few of us at the office are able to crack a smile thanks to collapsing gasoline prices–AAA says that the average price for regular unleaded peaked at $4.11 per gallon on July 17, and has dipped under $2 (actually under $1.90) this week. That’s a 54% drop in four months!

Which leads me to a question that was recently raised by someone: Wouldn’t it be great if we could lock in these gasoline prices, so that we’d be guaranteed to pay less than $2? At first, such a question just brought a chuckle. But then I began to think about it, and I discovered that there is a way to hedge your gasoline consumption.

The instrument you can use is the U.S. Gasoline Fund (UGA), which is an exchange-traded fund that tracks the price of gasoline futures. And my off-the-wall thought is this: If you want to “lock in” the current price of gasoline, you can buy some of UGA. Here’s how.

Let’s say you drive approximately 14,000 miles a year and your car gets 20 miles per gallon. That means you use about 700 gallons of gasoline per year (14,000 divided by 20 = 700). At the current rate of about $2 per gallon, that means you’re spending $1,400 per year for gasoline.

Thus, you could buy $1400 worth of UGA and hold on to it for a year. If gasoline prices rise … and you end up paying more at the pump … you’ll also end up making money on your UGA shares. For example, let’s say the price of gasoline rises 50% next month, and then stays level for all of 2009. (Unlikely, I know, but bear with me.)

That means you won’t pay $1,400 for gasoline at the pump, but $2,100 instead. However, it also means the value of your $1,400 of UGA will rise 50% to $2,100. In this scenario, you’ve “lost” $700 at the pump. But you’ve made $700 on your UGA shares. The converse is also true. If gasoline prices continue falling, you lose on your UGA shares … but, of course, you’ll “gain” by paying less at the pump.

Of course, it’s not that simple. There are commissions and taxes to consider. And, of course, gasoline prices fluctuate all the time. But the overall point is valid–if you invest in UGA, you’ll be “hedged” in case prices rise.

Is this a bit too cute? Possibly. I’m not saying I’ll rush out to buy UGA tomorrow, even though I do commute a total of 50 miles per day to work; for the average Joe, such a tactic might not be worth it.

But if you have a few family cars that you’re footing the gasoline bill for, if your job demands many more miles in commuting, or if you own a small business that operates a fleet automobiles (a small delivery service? A limo service?), it’s an option that’s available. Just something to consider as you s-l-o-w-l-y digest your Thanksgiving turkey (and mashed potatoes and green beans and squash and … ).

Thursday, November 27, 2008

Investing in the Era of “–Flation”

By John Cavalieri and Bob Greer, Real Return Product Managers

“…expect a lengthy recession but not a depression, accelerating government deficits...and the eventual rise of inflation….”

Bill Gross
Investment Outlook
October 2008

In the short term, the U.S. and the rest of the developed world do not have to be overly concerned about rising prices as those economies are slowing down. But economic forces are gathering over a larger, secular timeframe to generate “–flation” in the U.S. and around the world. Government response to the current financial crisis will actually add to longer-term –flationary forces. This could take the form of re-flation, in-flation, stag-flation or a combination of the three over time. (It’s unlikely to be de-flation or dis-inflation over a secular timeframe.) While these –flationary scenarios may not be desirable economic conditions, they need not be detrimental to portfolio returns. To the extent investors recognize this regime shift, they can reorient their portfolios away from asset classes that perform well in disinflation, which defined the last quarter century, and into those that are well-suited for the era of –flation going forward.

Defining “–Flations”
Knowing where we are in an economic cycle can help investors position their portfolios.

Reflation refers to a rising rate of inflation. This is not necessarily a bad thing, depending on the starting point. The U.S. rate of inflation in February 2004 was so low (core CPI was approximately 1.25%) that some observers, including central bankers, feared the U.S. might slip into deflation, which was almost universally considered to be undesirable. Japan’s “lost decade” was not what anyone wanted for the U.S. In this situation, the U.S. Federal Reserve aggressively cut short-term interest rates to 1% specifically to engineer reflation and create a cushion above deflation. Though a positive in this context, reflation can become undesirable if it leads to inflation.

Inflation, for the purposes of this paper, is an undesirable rate of price increases. While central banks of developed countries generally consider 2% to be an acceptable rate of price increases, reflation that leads to inflation above that level causes central banks to worry.

Classic inflation is usually accompanied by – or, more accurately, driven by – strong economic growth. In this case, inflation is the symptom of strong aggregate demand that is outpacing the economy’s ability to supply goods or services. However, inflation sometimes occurs during periods of low, or stagnant, economic growth. In this case, the emergence of inflation is not driven by an increase in domestic demand, but by a relative constraint on supply. Supply constraints can be driven by a variety of factors, such as exhausted capacity, depletion of resources, geopolitical conflict, trade policy or demographics. The combination of low or negative growth and rising inflation pressures creates stagflation. This economic scenario is not as easy for central banks to deal with, since policies that seek to improve one condition tend to worsen the other.

Causes of –Flation
Mainstream economic thought will ascribe –flation to easy monetary policy (low real yields on Treasuries), fiscal stimulus (fiscal deficits), or both. But there are other factors as well, including trade deficits (which can lead to a weaker currency), rising costs for labor or commodities, and shifting demographics.

In the U.S. and most other developed economies, we see fiscal deficits today.

Before recent events in the U.S., the deficit was on the increase because of the federal government’s attempts to stimulate the economy. Because so much of federal spending is for mandated entitlements whose liabilities will be increasing over time (e.g., Social Security and Medicare), it will be difficult to reduce fiscal deficits in the next several years. And now that the U.S. government will need to support large banks, mortgage-laden government-sponsored enterprises (GSEs) and other institutions, the fiscal deficit is likely to increase further.

Meanwhile, real yields on Treasuries are at the low end of their historical range, and the U.S. Federal Reserve is more likely to keep rates low than raise them at a time when economic growth is very slow. Other central banks, even if they do not have the dual mandate of the U.S. Fed, still are not likely to raise rates in pursuit of their single stated goal of curbing inflation. In emerging economies we have seen overly stimulative monetary policies, which fuel high domestic levels of growth and inflation. China, for instance, recently loosened interest rates. This is driven in some cases by their decision to peg their currency to the U.S. dollar (either fixed or managed) in order to maintain a level of currency parity with the world’s largest consumer of imports. The downside, however, is that pegging one’s currency means giving up control of domestic interest rates, which forces the emerging economy to import an overly stimulative U.S. monetary policy.

As the U.S. runs a fiscal deficit, it has also continued to import more than it exports, leading to a widening trade deficit.

This constant flow of dollars into the international economy, coupled with lower rates that those dollars earn, has caused the dollar until recently to weaken relative to other currencies. This in turn increases the cost to U.S. consumers of any goods or services purchased abroad.

Two other drivers of higher cost over a secular timeframe are labor and commodity prices. For the last several years, developed economies have relied on goods imported from emerging economies (most notably China) that have low labor costs. As those emerging economies strengthen, they are increasing their internal demand for goods and services and in the process starting to experience inflation themselves, including rising wage rates. The U.S. cannot rely forever on low Chinese labor costs to keep its own inflation under control. This is already changing.

Until this summer, we heard about rising commodity prices as well. We saw it most obviously at the gas pump, but in fact a very broad range of commodity prices increased. While there may be short-term dips, commodity prices are likely to rise over a secular timeframe. Infrastructure (supply, storage, processing, transportation) for many commodities is strained, and it will take many years and hundreds of billions of dollars for that to change. Before they provide this necessary investment, sources of capital will have to see high prices for an extended period of time, and believe that these high prices will continue. The current dip in commodity prices, however, has created uncertainty about the stable high prices needed for long-term investment. (It should be noted that the price declines resulted not from increased supply, but from reduced demand expectations due to the slowing economy.) Meanwhile, demand for energy in the short run is fairly inelastic, and demand for food is inelastic in both the short and long run. There is no action that central banks can take to provide the world any more oil, wheat or coffee. And the traditional solution to inflation, which entails slowing the U.S. economy, does little to reduce demand for energy and food, especially since these prices are driven by global, not local, supply and demand. Fed policy, at least, can reduce demand for “infrastructure” commodities such as industrial metals. But these infrastructure commodities are less important in most measures of consumer inflation. Fed policy may also reduce demand at the margin for other commodities should it sufficiently slow the world’s largest economy, but that is akin to using a very blunt tool to address a delicate, specific problem.

Finally, demographics over the next several years and beyond will have an impact on –flation. The obvious demographic factor is that as U.S. baby boomers retire, Social Security and Medicare payments will increase, exacerbating fiscal deficits. But there is a more subtle demographic factor to consider as well: as the average age of a population increases, there will be fewer productive workers compared to retired people. Each productive worker has to provide goods and services for her- or himself and for an increasing proportion of retirees. For instance, in the U.S. at the moment there are about five active workers (ages 20–65) producing goods and services for themselves and for one person over 65. Based on current demographics, within 15 years there will be only three active workers for every person over 65. Similar demographics exist in many other developed countries. Even if retirees have the money to pay for these goods and services, this shift in supply and demand is likely to drive up prices of those goods and services.

The persistence of inflation on a global basis is evident in the comparison of actual inflation to target inflation around the world. Economies around the world are not hitting their targets, as shown in Figure 7.

–FLATION IS GOING TO REPRESENT AN INVESTMENT CHALLENGE

Investment Implications
Critical to achieving a successful investment outcome are two key steps: 1) recognizing the underlying macroeconomic environment that is likely to define the investment horizon, and 2) aligning a strategic asset allocation accordingly. Specifically, investors should consider two fundamental macroeconomic variables – real economic growth and inflation – and further consider two possible states for each – high/rising or low/falling. This simple 2×2 matrix provides an intuitive framework for identifying the four basic states of an economy.

Once investors identify the most likely current and forthcoming states of an economy, they can then construct a portfolio that emphasizes assets that are likely to perform best in those states.

With this framework it becomes clear that the simple stock-bond mix that has come to define a “core” or “balanced” allocation falls short of diversifying investors across the four possible macroeconomic states. Specifically, the stock-bond mix only makes sense in a low or disinflationary world, and only if the investor has ruled out the possibility of a handoff to higher inflation. Given PIMCO’s secular outlook, which explicitly calls for a regime shift to a world of rising inflationary pressures, this allocation approach is not optimal.

This forces a simple question: Why would the broad investment community allow such a glaring omission in a strategic asset allocation?

The answer appears to be driven by the shared and rather homogenous disinflationary experience of today’s investment community. Specifically, for the last quarter century, developed economies have experienced a virtually uninterrupted period of disinflation. Beginning in the early ‘80s, inflation has steadily declined in developed economies from the teens to the “Goldilocks” level of 2%–3%. Since inflation was in secular decline, the only economic variable in play on our 2×2 matrix was the level of real growth. Therefore, it made perfect sense for investors to focus on stocks and nominal bonds within their core portfolio, since they only needed to be diversified with respect to the level of real growth in a disinflationary context.

What made perfect sense in the rear-view mirror makes less sense when looking through the windshield and seeing a future more likely to be defined by rising inflation than falling inflation. What does this mean for investors? In our view, a few themes are clear:

  1. The traditional stock-bond mix does not properly align investors’ strategic holdings with secular macroeconomic forces. At a minimum, we feel this calls for increasing exposure to real assets, notably commodities and inflation-linked bonds (ILBs).
  2. In a world in which inflation risk is to the upside, fixed-rate Treasury bonds should no longer be viewed as the “risk-free”* asset. Rather, ILBs assume that role, since they uniquely help protect investors from inflation risk given their CPI-linked payments. (Of course, if ILBs are not held to maturity, they may underperform just as any other fixed income security that is subject to interest rate risk.)
  3. Within the “low real growth” half of the matrix that is typically centered on bonds, investors should consider separating their desired “spread risk” exposures from the underlying Treasury/ILB exposure. In other words, bonds can be disaggregated into various risk components. For instance, a corporate bond may be disaggregated into a Treasury bond + swap spread + issuer credit spread. In a world in which ILBs replace Treasuries as the “risk-free”* holding, investors should look for strategies that allow them to “port” their desired spread risk exposures on top of their desired Treasury/ILB mix and not be saddled with the disinflationary bias embedded in traditional fixed-rate spread sectors.
  4. Within the “high real growth” half of the matrix that is typically centered on stocks, we believe investors should diversify into commodities. Since commodity futures may perform well in a global macroeconomic environment characterized by strong global growth and constrained input supply, a commodity allocation can diversify the risk of equity underperformance amid supply-driven inflationary pressures. Plus, investors may benefit from the fundamental diversification benefits that a commodities allocation brings to a total portfolio, and from the fact that a commodities allocation allows investors to “cover their short position” with respect to future needs to consume commodities (i.e., food and energy) that they don’t own today.
  5. As growth declines (perhaps due to a monetary authority reacting to high inflation), we could see stagflation, in which case ILBs might still outperform nominal bonds due to high inflation accruals. Assuming the stagflation is caused by a constrained supply of food and energy, then pressure from the monetary authority may not be highly effective, since it can scarcely shift the highly inelastic demand for those goods.
  6. No economy is likely to remain in just one investment quadrant. Investors must always expect change and consider how it will affect their portfolios.

Conclusion
Economies, at varying speeds, will be moving from an era of disinflation to a –flation regime. And that –flation regime will not be static. An awareness of the investment implications of changing states of –flation can help investors to control their portfolio risks and achieve desired returns.

John Cavalieri, Real Return Product Manager
Bob Greer, Real Return Product Manager
November 2008

Wednesday, November 26, 2008

Jeremy Grantham's 1st Ever TV Interview

Click the link and sit through a brief commercial before the interview begins:

http://link.brightcove.com/services/player/bcpid370322720?bclid=1641837935&bctid=3012738001

Beyond the Ivied Halls, Endowments Suffer

The New York Times

November 26, 2008

Some of the nation’s universities are trying to sell chunks of their portfolios privately as their endowments swoon with the markets.

Among institutional investors, school endowments aggressively embraced private equity, real estate partnerships, venture capital, commodities, hedge funds and other so-called alternative investments over the last few years. Endowments with more than $1 billion in assets reported 35 percent of their holdings in these types of investments on average last year, a much greater portion than big public pension funds, for example.

Now they are balking. The value of some of these investments has fallen, and they are not easily shed because there is no public market for them, as there is for stocks. Worse, private equity and venture capital funds require investors to put up additional capital over time. Cash may now be in short supply at schools facing budget pressures and investment losses.

The University of Virginia, which has a $4.2 billion endowment, posted a letter on its Web site saying that it might explore the sale of some of its private equity holdings and would sell hundreds of millions of dollars in other assets.

Harvard, the granddaddy of endowments with $36.9 billion at midyear, is marketing its $1.5 billion stake in venture capital and buyout funds. And the $6.5 billion Duke University Endowment is weighing the sale of $200 million of its stake in private equity. Columbia University is also mulling the sale of some private equity holdings, though it is not a priority, according to a person close to the endowment who was not authorized to speak publicly.

“Our firm is getting calls every day from institutions that want to sell private equity partnerships as well as firms that have bought those stakes from schools and now want to resell them,” said Stephanie Lynch, the chief investment officer of Global Endowment Management, which oversees $1.5 billion in endowment funds.

Last year, the average seller got $1.04 for every dollar of face value, according to a report by Cogent Partners, an investment bank for institutions looking to sell such holdings in the secondary market. Since June, sellers have been getting 50 cents or less on the dollar, said Colin S. McGrady, a managing director at Cogent.

Paul Capital Partners is negotiating with Harvard for some of its private equity investments, which include “the best names in the venture business,” said David H. de Weese, global head of secondary investments. The firm is negotiating with six more major universities to buy portions of their private equity portfolios.

Harvard said it had received some bids, though it had not decided how it would proceed.

Some schools do not want to have to come up with the money that they have promised these alternative funds. Partly that is because their endowments have shrunk with the market. They also are not getting the payouts from earlier investments.

Historically, private equity and venture capital funds returned money to investors as deals matured even as the funds made “capital calls” for new investments. In that way, the demands for additional cash were muted. But payouts are shriveling this year, and will be smaller than expected next year.

Some endowments became very heavily weighted in investments that are not publicly traded. The University of Virginia, for example, disclosed that just 21 percent of its investment pool was in liquid assets, like stocks and bonds. It plans to sell at least several hundred million dollars in those assets and a comparable amount in its hedge funds through 2010 to meet its capital calls from private equity funds, resource managers and others. Real estate and timber investments are frequently structured as limited partnership funds, which can have periodic capital calls, like private equity funds.

Virginia is also exploring the sale of some older private equity stakes. The university’s chief operating officer, Leonard Sandridge, said the school had no liquidity issues.

“It is a little like having to go to a pawn shop,” said one university endowment manager who said its policy is not to discuss performance publicly. “People don’t want to admit they have to sell this stuff. I am sure that a lot of people overcommitted over the past couple of years.”

Some schools say they simply want to rebalance their portfolios. As the stock market has plunged, their private equity stakes may have swelled to a larger percentage than their target. A spokesman for Columbia said that its $7 billion endowment was mulling some sales, but only to rebalance the portfolio, and that it did not have to raise cash.

Selling stocks is a quick and easy way to generate cash for capital calls. It may be one factor in the sharp declines in stock prices in recent weeks.

If the financial markets stay depressed for a few years, endowments could wind up in serious distress. The endowment of the Museum of Contemporary Art, in Los Angeles, has shrunk to less than $10 million, among its lowest levels since the museum’s founding in 1979. The decline, from $40 million a few years ago, prompted the billionaire Eli Broad recently to offer $30 million toward the museum’s rescue.

Foundations can scale back their grant-making in hard times. Museums and schools generally count on their endowments to cover a portion of their budget, and its many fixed costs. Now, their overall returns are plummeting, and donors are receding,

The decline in the market value of the endowment and the need to spend from it on a regular basis to meet operating needs can be very difficult, said Alice W. Handy, whose firm, Investure, manages money for Smith, Barnard, Middlebury, Trinity and other schools. “Meeting spending requirements in a down market is a significant obstacle to building the endowment.”

The stampede into alternative investments was fed by a desire to imitate the Yale Model, an investment strategy developed by David F. Swensen, who diversified Yale’s endowment portfolio beyond stocks and bonds into hedge funds, private equity, real estate and commodities.

David A. Salem, who manages the Investment Fund for Foundations, says few managers can match the skills of a Yale or Harvard endowment and many overpaid for those assets. “So it’s no surprise that the scrambling going on to liquidate some of this stuff is the product of equally unenlightened methods that are conditioned by the same illogical assumptions,” Mr. Salem said. (His group recently purchased a position in a private equity fund, after two higher bids were rejected because of concerns about those prospective buyers’ creditworthiness.)

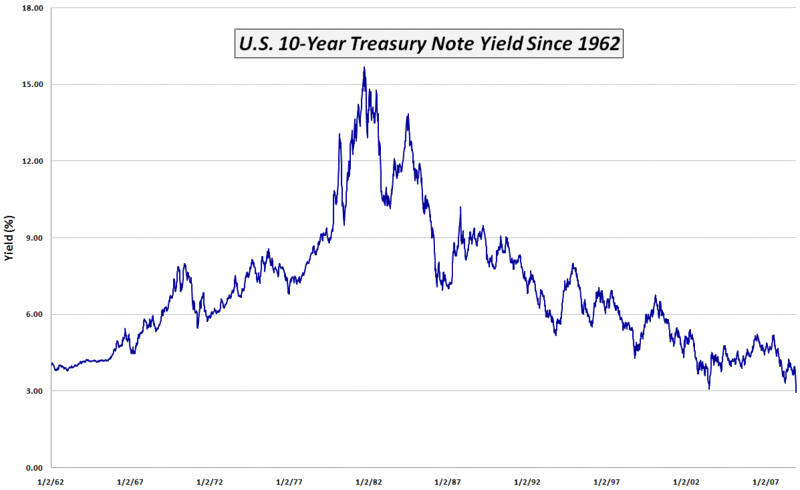
Along the way, schools have wound up with relatively small amounts in fixed-income investments: a traditional source of income to withstand bad times.

“The liquidity issue may be more widespread than people would have reason to anticipate,” said Eugene J. McDonald, founding president of the Duke Management Company and chief investment officer at Duke University for 18 years.

Stephanie Strom contributed reporting.

Tuesday, November 25, 2008

Analysts At Their Least Bullish Levels Ever

While Wall Street analysts are typically known for being overly optimistic, based on at least one measure, they have never been less bullish. According to Bloomberg statistics that track analyst buy, sell, and hold ratings, only 36% of all ratings are currently buys. As the chart below shows, this is the lowest level since at least 1997, and significantly lower than the 75% level we saw in 1997 and 2000. However, since the Spitzer crackdown on Wall Street research and the bursting of the tech bubble, analysts have grown increasingly shy about putting a buy rating on a stock they cover.

Buy Ratings

Monday, November 24, 2008

Corporate Insiders In Buying Frenzy

As the market races to the bottom, corporate insiders are racing right along buying with both hands. For the past four weeks, insider activity as monitored by InsiderScore, corporate executives and board members have been in what can only be described as a buying frenzy.

According to InsiderScore, “insiders are more bullish now than at any time since the two weeks immediately following the Black Monday market crash of October 1987“:

insiderscore buy sell ratio of corporate insider activity
Source: InsiderScore.com and SentimenTrader.com

canadian insider activity nov 2008
I checked with a similar service that tracks Canadian stocks: Canadian Insider and not surprisingly, the Canadian market is showing a similar pattern of insider buying.

The pattern was especially noticeable for Canadian REITs. And I’m not referring to ESOP where there is a preset schedule. REIT insiders are going out into the market and buying of their own volition. RioCan REIT, which I mentioned a few days ago, had 11,440 units purchased just on November 19th and November 20th, as an example.

The same can’t be said about precious metal stocks. For example, Barrick (ABX) and NovaGold (NG) do not show any buying interest from corporate insiders. If anything, there is a slight bias of selling. Which means that while insiders as a group are very bullish, they are still being selective. The k-ratio fell to 0.23 and has rebounded with Friday’s move in gold. That’s getting close to an attractive level for gold stocks, but if we are headed for a deflationary spiral, gold doesn’t stand a chance. But so far, the Philadelphia Gold Bugs Index (HUI) has bounced off the 175 level which I mentioned would act as support.

There’s Always a But…
A caveat to consider: in September 2007 insiders were enthusiastic buyers. Although not nearly as now. That uptick in buying was, of course, not very profitable since most stocks topped out shortly afterward. The question now is, does today’s frenzy mean that insiders see real value or will we simply see the market fall more and insiders get even more excited about buying?

Whatever the answer to that, the solace that the current buying pattern does provide is that insiders are not selling. The worst possible scenario after all, would be to see the “smart money” insiders bail out after the market’s face melting 50%+ decline.

Markets need a history lesson

So says, err, Citi.

50 years of financial orthodoxy is being questioned. Assets are being priced back to the 1930s. Does this reflect the end of modern financial theory?

That’s the bank’s pan-European team in a recent note. The central argument seems to be that the market is ignoring 50 years of financial history in the way it’s pricing assets like cash, equities, etc. today. For instance, by Citi’s calculations, long-run capital returns from owning European and/or UK equity have fallen from about 7 per cent in 2006-07 to 4 per cent today. The average between 1919 and now was 5 per cent — so we’re still below the average. Why the change?

As the financial crisis has evolved, risk has been aggressively re-priced. Corporate bond spreads have gapped out. Equities have been violently derated. Cash and government bonds have outperformed. Fear has beaten greed. Capital preservation has beaten capital return… The attraction of cash in absolute yield terms has fallen materially, and should continue to fall. By contrast, yields on risk assets, such as equities and corporate bonds, appear to offer investors rare attraction.

The below chart shows how many standard deviations certain asset classes are trading away from 10-year average levels (on a yield basis). In otherwords, when yields are trading above 10-year averages, this implies more attractive yields on offer to longer-term investors according to Citi, and vice-versa. So is Citi saying it’s time to forsake the safe-haven of things like cash for say, equities?

Not quite. Instead they’re arguing investors think twice before selling stuff like equities to enter cash:

Comparing current yields to 10-year average levels: equities have never looked so cheap, cash has never looked so expensive. This does not mean that share prices have hit their lows for this cycle. Indeed, the prospect of further forced selling and big earnings decreases pose significant hurdles. But, we believe long-term investors and asset allocators should think hard before selling beaten-up risk assets in favour of risk-free assets from here.

Citi chart

Sunday, November 23, 2008

Record Breaking Data Everywhere

One of the interesting aspects of this unprecedented housing collapse, credit crisis, economic recession and market crash has been all the new records we keep seeing:

• Over the past year, the S&P 500 index lost ~$1 trillion more than the entire 2000-2002 bear market, according to Standard & Poor’s. From the October 2007 highs of 1,565, to yesterday’s close of 806.58, the S&P 500 market capitalization lost $6.69 trillion. That’s almost $1 trillion more than entire 2000-03 bear market losses of $5.76 trillion. (Marketwatch)

• The S&P 500 hasn’t been this far below its 200-day moving average on a percentage basis since The Great Depression. (Doug Kass)

• CPI: U.S. consumer prices in October registered their largest single-month decline since before World War II. It is the largest monthly drop in the 61-year history of the data;

• PPI, down 2.8% for the month, was also record breaking drop.

• The dividend yield on the S&P 500 is now greater than the yield on the 10-year Treasury. That hasn’t happened since 1958. (Barron’s)

• First-time claims for U.S. unemployment insurance rose to the highest level since September 2001. The total number of people on unemployment benefit rolls jumped to the highest level since 1983.

• Housing starts fell to 791,000, off 38% from a year ago. That’s the slowest pace of starts since data began being compiled in 1959. Starts are now down 65% from the early 2006 peak — this has become the very worst housing downturn on record.

• Permits for new houses, at a 708,000 pace, were off 40% from a year ago, also the lowest total since it has been tracked starting in 1960. Put this into context of population — in 1960, the total U.S. population stood at 180 million — 60% of today’s 300 million.

more Doug Kass: The 30-year return for BBB-rated corporate bonds is now greater than the 30-year return for stocks. So it has not paid to take equity risk for 30 years! (The Street.com)

• The TIPS Spread ( Treasury Inflation Protected Securities versus the 10-year Treasury) is at a record low 54 basis points (1997)

• The Russell 3,000 now has 1228 stocks a share price under $10. That’s 42% of the index. At the market’s 2002 lows, there were significantly less stocks trading below $10/share — just 884 (Bespoke Group).

• The ratio of the Dow to the SP 500 is at a 42-year high. It’s inches away from hitting 10 for the first time since 1966. (Crossing Wall Street)

Here’s another one of those bizarre stats of the year for you:

Out of the 11,585 U.S. and international stock mutual funds tracked by Morningstar Inc., 11,584 have lost money in 2008, according to fund data through Nov. 20.

In other words, just one fund hasn’t lost money this year—and that is the APX Mid Cap Growth Fund, which was flat through Thursday’s close. That’s right, folks, its return—or lack thereof—is a mere zero thus far in 2008.

Given that most equity mutual funds are required to be fully (or 90%) allocated, its really no surprise. But its such a stark statistic, I thought it was worth mentioning.

Pretty wild . . .

Friday, November 21, 2008

S&P 100 P/E Ratios: How Low Can They Go

Below we highlight stocks in the S&P 100 (what once were considered blue chips) with the lowest estimated P/E ratios based on earnings expectations for the next four quarters. Even if earnings came in it at half of expectations for these companies, their valuations would still be attractive in a normal market environment. But because there is so much uncertainty about the future of these stocks and the US economy as a whole, investors aren't taking any chances. While some of these companies might not make it, there are no doubt some great bargains in the stocks that do make it through these tough times.

Estimatedpes

Thursday, November 20, 2008

The Lost Bull Market of 2002 - 2007

The S&P 500 has now erased 100% of the bull market from 2002 to 2007. Like the lost city of Atlantis, the bull market we enjoyed from 2002 to 2007 has now been relegated to the status of legends. People may talk about it for generations, but looking at the levels of the major indices, there is no longer any proof that it ever existed.

Lost Bull Market

Four Large Bear Markets

Wednesday, November 19, 2008

Current Asset Declines On Par Or Worse Than The Nasdaq Bust

The bursting of the Internet bubble and the 78% decline in the Nasdaq from its peak was one that many thought would be tough to repeat. However, the current decline in the S&P 1500 Homebuilder index makes the Nasdaq declines not look so bad. From its peak in July 2005, the homebuilder stocks have now lost 85%! And the S&P 500 Financial sector doesn't look much better. From its peak early last year, the financial sector has lost 71%. Many would argue that this 71% decline is much worse than the Nasdaq or the homebuilders since the financial sector didn't experience nearly the same gains on the upside. And even though oil isn't down as much as the others, the rapidity of the commodity's declines make it just as shocking. Over the last 97 trading days (early July), oil has declined 63%.

Peakdeclines

High Yield Spreads: No Slowdown in Sight

If you're looking for signs of stabilization in the credit markets, the high yield market is not a good place to start. Based on data from Merrill Lynch, high yield bonds are yielding nearly 1,800 basis points more than comparable Treasuries. In the last month alone, spreads have risen by more than 200 basis points, and since bottoming in the Summer of 2007 at 241 basis points, they are up 645%. To put this in perspective, with the 10-Year US Treasury now yielding 3.4%, a high-yield borrower would need to pay roughly 21.4% per year to take out a ten-year loan. With terms like these, who needs loan sharks?

High Yield Credit Spreads 111908

Kass: S&P Yield Eclipses 10-Year Yield

Yesterday afternoon, my friend/buddy/pal, Barron's Randall Forsyth, called to ask me what was the meaning behind the dividend yield of the S&P 500 (3.57%) having had eclipsed the yield on the 10-year U.S. Treasury note (3.54%) for the first time in 50 years.

Many who were interviewed by Randy suggested that the phenomenon signaled a stock market bottom. By contrast, I viewed the significance of the yield differential (or lack thereof) as more of an indication that the forces of economic contraction will be greater than the forces of economic expansion over the next several years.

"It's a general sign of profound risk aversion (and a flight to quality)," adds Douglas A. Kass, who heads Seabreeze Partners Management. "And in a broad sense, the absence of a differential [between the S&P 500 and Treasury 10-year yield] reflects a growing sense that corporate profit growth will be limited over the next couple of years," he says.

-- Barron's, Up and Down Wall Street: "Reversal of Fortunes Between Stocks and Bonds"


In support of my conclusion is that the bond/stock yield relationship in the U.S. has gone global. For instance, the Japanese TOPIX Index yields approximately 2.8%, which is nearly twice the yield on 10-year Japanese government bonds.

I went on to suggest to Randy that the lack of a difference in yield also reflects the low level of expected future inflation, which is best expressed in the TIPS spread (the difference between regular and inflation-indexed notes), implying that the consumer price index will rise by just 0.64% annually for the next 10 years.

If I am correct in my assessment that the meaning of the similarity of the yields on both stocks and bonds is that an extended period of sluggish corporate profit growth lies ahead, we might all be served by the many virtues of cheap tequila.

Monday, November 17, 2008

S&P 500 200-Day Moving Average Spread at -32%

Multiple market pundits have recently mentioned that the S&P 500 is trading the furthest below its 200-day moving average since the Great Depression. Below we have plotted the 200-day spread indicator going back to 1927. The index is currently trading 32% below its 200-day moving average, which is indeed the most negative spread since 1937. While the spread can remain negative for quite some time, the reaction to the upside has been extreme once the market turns. In the 1930s, and even following the big declines in the 70s, 80s, and early 2000s, the spread turned violently positive in the months following the ultimate low in the 200-day spread. Unfortunately, nobody knows when that low will be.

200dayspread

Private equity's basic math problem

Investor Daily: A balancing problem is causing a selloff in private equity - and providing opportunity for a little-known subset of investors.

By Michael V. Copeland, senior writer
Last Updated: November 17, 2008: 9:15 AM ET

(Fortune Magazine) -- Not since fourth grade have so many sophisticated investors been so troubled by a basic math equation. An asset-allocation problem called the "denominator effect" is forcing the selloff of billions in private equity and alternative investments.

The problem is straightforward. Portfolio managers have strict guidelines for asset allocation (Harvard's endowment, for instance, is offloading $1.5 billion in private equity to get back to its 13% target.) As the public markets have collapsed and the prices of liquid assets have plummeted, the value of the overall portfolio, or the denominator, has shrunk.

But allocations to venture funds, buyouts, and real estate, which aren't priced often, have held - at least in theory. So a slice that once accounted for 10% of a portfolio now might suddenly account for 15%.

There are two things that fix the problem: a rising market for stocks or portfolio managers rebalancing by selling off the private-money investments.

The latter is starting to happen, with Harvard, Duke, and others unloading alternative-asset portfolios or portions of them. If they aren't already, say industry insiders, practically every big endowment or pension fund soon will be putting something up for sale.

The Great Unwinding of 2008 is providing opportunity for investors in the so-called private equity secondary market, an obscure corner of the private-money universe that trades preexisting commitments to alternative-asset funds.

By buying these castoff units, secondary-market investors hope to capture the higher returns of alternative assets, and because they can pick and choose among funds or even individual companies, they do it with slightly less risk.

Because the shares provide liquidity, they are typically discounted; in bad times, when everyone is scrambling for cash, they can get dirt cheap. Bids for shares in the top buyout funds have already fallen by almost 14% this year, according to NYPPEX, a Greenwich, Conn., secondary-markets advisor.

Secondary buyers are anticipating further write-downs and lower prices in coming months, especially for the sale of shares in firms like Blackstone (BX), Bain Capital, and others that from 2005 to 2007 paid huge multiples and used massive leverage for companies now in their portfolios.

Some buyers are bidding as little as 50 cents on the dollar; earlier this month, according to industry sources, Lehman Brothers sold part of its $3 billion private equity portfolio at a 50% discount.

As prices fall, the volume of these transactions is soaring. Larry Allen, managing member of NYPPEX, estimates that there will be some $27 billion in private equity secondary deals this year, up from $18 billion in 2007.

"We expect the volume to accelerate into 2009 for all kinds of alternative assets," he says. 'The buyers smell blood in the water."

Yield Curve Near Ten Year Highs

The yield curve is an often quoted measure of the relationship between short and long term interest rates on US Treasuries. While there are many variations, the most often quoted measure is the difference in the yields between the 10-Year and 3-Month US Treasuries. While the curve is normally positive (ten-year yields more than three month), there are times when the three month yields more than the ten-year, causing the curve to invert. When this occurs, monetary conditions are considered to be tight and the market is anticipating a slowdown in economic activity. In most periods when the curve becomes inverted, a recession is typically not far behind.

As shown in the chart below, over the last ten years the yield curve and the S&P 500 have had an inverse relationship (we recently published a more detailed analysis for Bespoke Premium subscribers where we summarized the S&P 500's performance based on different readings in the yield curve). In late 2000, when the market and the economy were near their peaks, the yield curve was near its lows. As the economy weakened, the S&P 500 declined and the yield curve started sloping upwards.

While an inverted yield curve has been a reliable precursor of impending economic weakness, steeply sloped yield curves have historically been a sign that the market is anticipating strength in the economy (as was the case in 2002 and 2003). If this is the case, just as the market is now awaiting the NBER's official recession call, one year from now, we may be waiting for the NBER to say the recession has ended. The current difference between the yields on the 10-Year and 3-Month Treasuries is 360 basis points, which is near the highest levels of the credit crisis as well as the highest levels of the last ten years.

Yield Curve

Sunday, November 16, 2008

The cost of living in the U.S. probably fell in October by the most in almost sixty years

By Bob Willis

Nov. 16 (Bloomberg) -- The cost of living in the U.S. probably fell in October by the most in almost sixty years, while manufacturing and homebuilding sank deeper into a recession, economists said before reports this week.

Consumer prices probably dropped 0.8 percent last month, the most since 1949, according to the median estimate in a Bloomberg News survey. Builders broke ground on the fewest houses in at least a half century and factory output weakened further, other reports may show.

Commodity costs plunged in October when the economy, which descended last quarter, went into freefall as credit and financial markets collapsed. Slumping sales are forcing retailers to lower prices, giving the Federal Reserve scope to keep cutting interest rates to limit the damage.

``Tumbling energy and commodity prices have altered the inflation landscape,'' said Ryan Sweet, a senior economist at Moody's Economy.com in West Chester, Pennsylvania. ``More rate cuts are needed as the economy is sinking deeper into recession.''

The Labor Department's consumer-price report is due Nov. 19. Fuel, clothing and auto costs probably dropped last month as sales at U.S. retailers fell 2.8 percent, the most since records began in 1992, economists said.

The slump in crude oil is feeding through to prices at the pump. The average cost of a gallon of regular gasoline plunged 17 percent last month to $3.08, according to AAA.

Commodity Deflation

``We are seeing the fallout of global recession on inflation,'' said Nigel Gault, chief U.S. economist at IHS Global Insight in Lexington, Massachusetts. ``In commodity prices, it's leading to deflation.''

Core prices, which exclude food and energy, rose 0.2 percent last month after a 0.1 percent gain the prior month, according to the survey median.

A report from the Labor Department on Nov. 18 may foreshadow the drop in retail costs. Wholesale prices fell 1.8 percent last month, the most since records began in 1947, according to economists surveyed.

As sales fall, manufacturers are cutting output and firing workers. Ford Motor Co. plans temporary shutdowns at nine North American plants this quarter after an 18 percent drop in U.S. sales this year, Angie Kozleski, a spokeswoman for the Dearborn, Michigan-based automaker, said last week.

Auto cutbacks probably pushed down manufacturing output last month, economists said a report from the Fed tomorrow may show. Overall industrial production, which includes factories, mines and utilities, rose 0.2 percent in October, led by a resumption of work at Gulf Coast refineries after Hurricane Ike shut down oil rigs the prior month, economists forecast.

Hurricane Rebound

A report from the New York Fed the same day may show manufacturing in the state contracted this month at the fastest pace since at least 2001. A similar report from the Philadelphia Fed on Nov. 20 may show regional activity shrank for an 11th time in 12 months.

The economic slump will intensify this quarter and persist into the first three months of 2009, making it the longest downturn since 1974-75, according to economists surveyed this month.

The housing recession at the heart of the economic downturn shows no signs of letting up. New-home starts in October dropped to a 780,000 annual pace, the lowest level since records began in 1959, the Commerce Department is forecast to report Nov. 19.

Outlook Dims

A gauge of the economy's course will point to continued weakness, economists project a private report on Nov. 20 will show. The New York-based Conference Board's index of leading economic indicators probably fell 0.6 percent after increasing 0.3 percent in September.

Central bankers are battling to cushion the economy from the worst financial crisis in seven decades.

``Policy makers will remain in close contact, monitor developments closely and stand ready to take additional steps should conditions warrant,'' Fed Chairman Ben S. Bernanke said Nov. 14 at a panel discussion in Frankfurt hosted by the European Central Bank.

Heads of state of the Group of 20, which represents almost 90 percent of world output, met in Washington Saturday to lay the framework for coordinated actions to stem the global recession.

Friday, November 14, 2008

Corporate Bond Spreads

Here’s a fascinating look at corporate bond yields over the past 90 years. I got the data off the Federal Reserve Bank of St. Louis’ data bank. This chart shows the yields of Moody’s index of Aaa and Baa seasoned corporate bond yields.

image734.png

You’ll notice that the gap has widened significantly. This signifies what we already know, that lenders have become extremely risk-averse. Here’s a look at the difference between the two yields:

image735.png

The premium for high-quality lenders is as high as it’s been since the recession of the early 1980s. We’re still a long way from the spreads we had during the Great Depression.

That data series is based on monthly averages, so to zoom in a little, let's look at the weekly data which begins in 1962.

image736.png

image737.png

According to the daily series, which goes back to 1986, the spread reached 312 basis points on October 27. That's the widest spread found in the daily records. According to my calculations, the entire gain of the S&P 500 has come when the spread is 96 basis points or less. The spread has been more than that every day for almost a year.

Standard & Poor’s says active Fund Managers - - both US and international - - underperform benchmarks over long periods of time

http://www2.standardandpoors.com/spf/pdf/index/111208_SPIVA_midyear2008.pdf

Hedge Fund Assets and Leverage

Bypass the Depression and Head Straight for 1907

51WglWku4XL._SL160_ On Oct. 17, 1907, panic began to spread on Wall Street after two men tried to corner the copper market. In the months preceding the panic, the stock market was shaky at best; banks and securities firms were contending with major liquidity problems. By mid-October, Wall Street was paralyzed; for days, there were runs on several large banks. Millions of dollars were withdrawn, and banks closed their doors."

Sound familiar? The above passage is from an article on the NPRs website titled "Lesson's From Wall Street's Panic of 1907." 101 years later, the US economy finds itself in an eerily similar situation, and following today's lunchtime plunge in the Dow, the index is now closing in on 1907 to be on pace for the index's worst year ever.

Ten worst years

Tuesday, November 11, 2008

Getting it right and still losing

Commentary: You can get a lot of things right and still lose big

By Mark Hulbert, MarketWatch
Last update: 11:00 p.m. EST Nov. 11, 2008
ANNANDALE, Va. (MarketWatch) -- Sometimes you can't win for losing.
Just ask Harry Schultz. Or Howard Ruff. Or Jim Dines.
All three advisers, each of whom has been editing an investment newsletter at least since the 1970s, have built their investment careers by questioning conventional wisdom's trust in the soundness of the financial system. Not surprisingly, all three have been vociferous champions of gold and other precious metals.
You'd think that they would have cleaned up over the last year, since the disintegration of the financial system in recent months is almost exactly what they have been warning us about for decades.
But you'd be wrong.
Of the 181 newsletters on the Hulbert Financial Digest's monitored list, these three advisers' newsletters are in 173rd, 175th, and 176th places for year-to-date performances through October 31, with losses ranging from minus 64.9% to minus 70.0%.
How can this be?
The easy answer is that these advisers didn't put into their model portfolios the securities that would benefit from the financial collapse that they envisioned.
But that's not a very satisfying answer. Why didn't they construct their model portfolios around investments that would rise when the rest of the financial world was going down?
The answer, as I see it, has to do with how difficult it is to forecast when a collapse will actually take place. It's one thing to know that the financial system is shaky, and quite another to forecast when it actually will crumble. And these advisers would have lost even more over the last several decades had they bet aggressively on a collapse every time they thought that one was imminent.
In essence, these advisers came face to face with John Maynard Keynes' famous pronouncement that "the market can remain irrational longer than you can remain solvent."
In fact, it turns out to be surprisingly tricky to construct a portfolio to profit from an anticipated collapse. You can't just own securities that will skyrocket during such a collapse, for example, since they will lose huge amounts during the months and years you wait around for that collapse to occur.
As a result, advisers who worry about a collapse sometimes end up constructing portfolios that are not all that different from those of other advisers who are more sanguine about the health of the financial system.
The ironies are many.
Researchers refer to the consequences of these dynamics as the "limits to arbitrage." One famous study conducted in the mid 1990s by Harvard economist Andrei Schleifer and University of Chicago professor Robert Vishny, for example, found that arbitrageurs more often become momentum players rather than hedgers: Rather than betting against an apparently obvious mispricing, they often will bet that a mispricing will continue and become even more extreme.
That's the theory, at least. And it only partially applies in individual cases such as the letters edited by Schultz, Dines and Ruff.
But, clearly, these three advisers would have constructed far more profitable model portfolios this year if they had known that the financial collapse they have so long warned us about would happen in 2008. End of Story
Mark Hulbert is the founder of Hulbert Financial Digest in Annandale, Va. He has been tracking the advice of more than 160 financial newsletters since 1980.

Comparing Valuations In China And The U.S.

Since US markets peaked last October, the S&P 500 is down 41%, while China's Shanghai Composite is down 68%. Over the same time frame, the trailing 12-month P/E ratio of the S&P 500 has gone from 19.62 to 20.21, while the P/E ratio of the Shanghai Composite has fallen from 45.85 all the way down to 14.31. So even though China's equity markets have declined much more than the US on a percentage basis, earnings have held up much better. China is still considered an emerging market and is experiencing growth of 8% or so. Growth stocks generally have much higher valuations than value stocks, and it's surprising to see China's P/E at 14.31, or 6 points lower than the S&P 500's P/E of 20.21.

Spxchinaprice

Spxchinape

Hedge fund star: Fears are overblown

Everyone's worried that hedge fund investors will pull their money out en masse and ignite another market selloff. That's not how it looks to one insider.

By Barton Biggs, managing director of Traxis Partners
November 11, 2008: 6:28 AM ET

(Fortune Magazine) -- Bear in mind two caveats as you peruse these comments. First, I run a hedge fund, so I am hardly an unbiased observer. Second, nobody, and I mean nobody, really knows what hedge fund liquidity is or what redemptions are or will be.

What follows are the enlightened - I hope - opinions of an aged participant about the unknown. I am, however, investing my money and others' on these opinions.

During the 40% bear market of 2000-2003, hedge funds and their fund of funds as a group posted positive returns each year. This exemplary performance spurred a huge boom, and the industry by the end of last year had more than 7,000 funds, managing an estimated $1.9 trillion worldwide. Big money and greed attracted less qualified, inexperienced, and trading-oriented participants.

In this year's killer bear market, hedge funds, with precious few exceptions, have suffered big losses, proving once again the truism that there is no asset class too much money can't spoil. Now the worry is that a tsunami of redemptions from disillusioned investors will force a deluge of hedge fund selling that will depress markets further.

I don't see that happening. For one thing, the panic has abated, and since most funds have losses to make up before they can begin to earn their performance fee again, investors who redeem now are forgoing a free ride. (Of course, they still have to pay the fixed fee.)

Another reason is that so-called long-only managers (mutual funds, investment counselors, traditional portfolios) have done even worse this year. So where are the redeemers going to put their money?

Most of the hedge fund money is in the big multistrategy funds run by the best and the brightest, and I suspect that institutional investors will be loath to abandon them. However, several thousand smaller hedge funds will go out of business, because of either poor performance or lack of scale.

There is no question that a lot of money is coming out of the hedge fund space. Let's look at the $1.9 trillion. Losses have probably reduced it by 25%, to $1.4 trillion. Based on what I see and hear, $350 billion to $420 billion will be withdrawn by the middle of next year. Probably about $150 billion has already gone.

That means that there is about $250 billion to go (again, I am talking worldwide). That's not a huge amount, but what the bears are terribly worried about is that presumably this money is leveraged, and so to raise the cash, hedge funds will have to sell two to three times that much.

In fact, at least one huge fund has been liquidating leveraged positions. But I don't think that's the start of a wave. First, the prime brokers for the industry report that the hedge fund industry's net long position is now around 20% of their equity, an all-time low.

Hedge funds have heard the redemption footsteps: They have already sold down their long portfolios and tremendously reduced their gross book and leverage. It is a fact that hedge fund margin debt has been declining since July 2007, and prime brokers report massive hedge fund cash holdings.

In every bear market I have seen, the doomsayers concoct a statistical argument that the glory days for stocks are over, because a flood of selling by brutalized investors is inevitable, and the buyers have no money. This case always seems most compelling close to the end of the declines and is always marked by a wave of media pronouncements. Remember Business Week's "The Death of Equities" cover in 1980? Recent covers from Business Week and The Economist have had similarly dire alarms.

Investors are licking their wounds. The peak-to-trough decline in the Dow Jones industrial average was 42.3%, the second worst since the Depression. The angle of descent has never been matched, and volatility as measured by the VIX index is at record levels. The Dow is 32% below its 200-day moving average, the widest spread since November 1937.

The bottom of a bear market by definition has to be the point of maximum bearishness, and I think we're there. For the market to go up, the news doesn't have to be good. It just has to be less bad than what has already been discounted. To top of page

Hedge Funds: October Performance Numbers

We have been anxiously awaiting the numbers from various hedge funds to see just how poorly (for the most part) many of them did in the abysmal month of October. If you'll recall, the indexes fell 10% or so in the month alone. Undoubtedly, the swift move caught a lot of people off-guard. Below, I've assembled a collection of performance numbers from various funds sourced from anonymous investors, hedge fund investor letters, and various media publications. If you missed it, you can check out our September hedge fund performance update to get a feel for how these funds were doing before the month of October struck. So, let's get right to it.


  1. Maverick Capital's Maverick Fund was -6.34% for October and is now -26.47% ytd. Lee Ainslie's fund is off the beaten path this year, as they are accustomed to solid annual returns. You can see their most recent investor letter here, and their portfolio holdings here.
  2. Viking Global's Global Equities III Fund was -1.10% for October and is -2.41% ytd. Their Global Equities LP is -3.92% for the year and was down 1.10% in October. Andreas Halvorsen and company seem to be faring alright this year, all things considered. You can view their month by month performance breakdown here.
  3. Barry Rosenstein's Jana Partners had a rough month. Their Piranha fund was -19.2% for October and is now -21.7% for the year. Additionally, their Nirvana fund fell 13.2% in October and is down 21.9% ytd. As you can see, a big chunk of their losses came solely from the month of October. You can check out some recent Jana portfolio updates here and read about their recent rough patch here.
  4. Steven Cohen's SAC Capital was -12% for October and now find themselves -18% year-to-date. Those performance numbers angered ole Stevie and he moved SAC to cash. Also, Cohen is said to be closing his CR Intrinsic fund, which is comprised of mainly his own personal money. [Dealbreaker]
  5. Farallon Capital was -9% for October and -23% ytd.
  6. Tontine Capital Partners was -65.7% in October and now down an astonishing 76.8% for the year. We recently detailed that they had revealed a 6.16% stake in Myr Group (MYRG). You can also find out where their pain was coming from by checking out Tontine's portfolio holdings.
  7. Peter Thiel's macro fund Clarium Capital was -18% for October and now find themselves -2.8% for the year. The month of October was disappointing for them, as they basically gave up the solid gains they had posted from earlier in the year. This was in part due to their shift to equities right before the carnage hit in October. We posted about Clarium's recent performance here and detailed their portfolio holdings here.
  8. Passport Capital's Global Strategy Fund was -38% for October and is now -44% for the year. We had previously written about Passport's performance here.
  9. Ken Griffin's Citadel continues to feel the pain as their Wellington fund was -38% for October and sits -44% for the year. We recently detailed Citadel's pain here.
  10. Bruce Kovner's Caxton Associates is faring decently this year. Their Global Investment fund was up 2.6% for October and sits up 7.25% year-to-date. They recently boosted their stake in Ferro (FOE). Here's the rest of Caxton's portfolio.
  11. Daniel Loeb's Third Point was -10.3% for October and is -26.9% ytd. Our most recent coverage of Third Point's portfolio can be found here.
  12. Paulson & Co's dominance continues. Their Advantage Plus fund is up 29.4% for the year after posting a +3.8% gain in October. Paulson & Co recently took a large stake in Cheniere Energy (LNG) and we previously saw them shorting UK banks.
  13. Philip Falcone's Harbinger Capital was -5% for October and finds themselves down only 13% for the year. The fund has had a wild ride this year, being up 42% in June and now -13% for the year. This can partially be attributed to the fact that their portfolio was previously littered with natural resource equities that had been obliterated such as Cleveland Cliffs (CLF) and Freeport McMoran (FCX). Check out how Harbinger profited from shorting Wachovia (WB) and view the rest of their portfolio here.
  14. David Einhorn's Greenlight Capital sees themselves -13% for October and now -26% for the year. We've covered Einhorn's portfolio activity here.
  15. Shumway Capital Partners' Ocean Fund was up 0.85% in October but is still down 8.24% for the year. The fund is ran by Chris Shumway, one of the many 'Tiger Cubs' we cover here on the blog. 'Tiger Cubs,' if you're not familiar, are pupils of legendary Julian Robertson's Tiger Management hedge fund. Shumway recently detailed some investment ideas at a 'Tiger Cub' hedge fund panel.

While many funds have found it difficult out there, others have gained footing. Obviously, in such a market environment, one would expect bearish funds to do well. And, that's exactly the case with $7 billion short-seller Jim Chanos. His Kynikos long-short fund is up 11% through the year. His Ursus short only fund is up 53% through October. And, he's done even better than his numbers last year, in which he returned 30%. And, in a comment with the NY Post, Chanos refused to name names, but revealed that, "We are short all of the satellite and most of the cable companies in the US."

Additionally, others have found a way to profit off the gloom and doom. Drury Capital is up 60% for the year with the help of their proprietary computer models. Conquest Capital, a $611 million macro fund ran by Marc H. Malek, is up 44% year-to-date. The scary part about his fund? Even with his stellar performance, he is still seeing redemption requests. That just goes to show that everyone simply needs cash. And, when in times of duress, sell your winners.

This has easily been the worst year for hedge funds in quite some time, thanks to yet another horrible month in October. As evidenced above, even some of the historically brightest managers in the game are stumbling. Such struggles will lead to even more investor redemptions and continued deleveraging. For more information and background on some of the prominent hedge funds mentioned above, head over to my posts on hedge fund manager interviews and Alpha's hedge fund rankings.

Make sure to check back with us here at MarketFolly.com as the new 13F filings start to pour in this week and next week. We'll examine these latest SEC filings that reveal the updated portfolio holdings of the hedge funds mentioned above.

Converts seem to have lost more than common sence would suggest

Reuters Summit-BlackRock money funds reverse most outflows

BOSTON, Nov 11 (Reuters) - U.S. asset manager BlackRock Inc said on Tuesday three-quarters of the cash that left its money market funds in the third quarter have since returned as government steps to back the industry have calmed investor fears.

"Since the end of the third quarter, the flows have been coming back into the money market funds. We've seen about three-quarters of the assets that left the funds come back into the funds," BlackRock President Robert Kapito told the Reuters Global Finance Summit.

BlackRock, the biggest publicly traded U.S. asset manager and one of the largest money market fund firms, said in October that it suffered $41.6 billion of outflows in its Prime money market funds.

The firm had said then that it saw $13.8 billion of net inflows in its money market funds since the end of the third quarter.

Kapito's comment would suggest net inflows have strengthened further. The BlackRock president did not reveal actual flow numbers.

Bear Stearns $30 billion mortgages may fare well

Tue Nov 11, 2008 2:58pm EST

By Dan Wilchins

NEW YORK (Reuters) - A $30 billion Bear Stearns mortgage portfolio backed by the U.S. government is generating cash flow as expected, and could end up being worth more than its market value implies, the portfolio's manager BlackRock said on Tuesday.

Speaking at the Reuters Global Finance Summit, BlackRock President Robert Kapito said that "the cash flows are coming in very close to what we had anticipated from the very beginning."

If this portfolio performs better than expected, it may indicate that investors were wrong to lose faith in Bear Stearns in March.

New questions may also arise regarding mark-to-market accounting, which requires banks to record some assets on their books at their market value. This accounting method, which can trigger big losses and capital hits for banks when asset values decline, has grown controversial.

"That's become a very big issue in the market place, is that you have securities where the cash flow is coming in very close to predicted values, but the current mark to market, because of the illiquidity ... has been a big pressure on companies' capital," Kapito said.

As of the end of September, the market value of the portfolio was $26.8 billion, compared with its original face value of $30 billion, according to a government report on October 23.

"I would say that the cash flows on these securities predict a higher value than what is currently marked to market," Kapito said.

The Bear Stearns mortgage portfolio's risk ended up mainly in taxpayers' hands in June after JPMorgan Chase & Co (JPM.N: Quote, Profile, Research, Stock Buzz) agreed in March to buy the faltering investment bank on condition the government guaranteed some of Bear's assets.

Oil Breaks Below $60

With oil breaking below the $60 barrier this morning, we thought we'd provide price charts of the commodity since 2000 and since this April. As shown in the first chart, even after oil's 60% decline since July, it still hasn't broken below its long-term uptrend line that started back in late 2001. With the speed and forcefulness of the declines in oil over the last couple of months, however, it shouldn't be long before this uptrend is at least tested.

Oil2000

Oilapril

Monday, November 10, 2008

Oxford University: The top ten most irritating phrases:

1 - At the end of the day

2 - Fairly unique

3 - I personally

4 - At this moment in time

5 - With all due respect

6 - Absolutely

7 - It's a nightmare

8 - Shouldn't of

9 - 24/7

10 - It's not rocket science

Sell Stocks, Buy Corporate Bonds

I have lots of models, but I am only one person, so some of my models sit idle becuase I don’t have time to update them. Well, today, as I was reading Barron’s, I ran across the “Current Yield” column, and read this:

THE STOCK MARKET IS PRICED FOR a recession, but the bond market is priced for a depression. So says Rob Arnott, the brainiac who heads Research Affiliates, an institutional advisory.

That’s not hyperbole. Corporate bonds rated Baa or triple-B, the low end of investment grade by Moody’s and Standard & Poor’s designations, offer the biggest yield premium since the early 1930s, notes RBC Capital Markets.

That’s a problem for pulling the economy out of the credit crisis, but an opportunity for investors. Indeed, investment-grade corporates with near-record premiums arguably offer better return potential than common stocks, especially relative to their risks. “I haven’t seen this many markets offering double-digit opportunities since 1989-90 or ever so briefly in 2002,” says Arnott.

Part of it reflects the sheer weight of numbers. Corporates rated Baa yield about 550 basis points (5.5 percentage points) more than comparable Treasuries, nearly half again the spread in the 2002 post-WorldCom-Enron debacle and twice the average of post-war recessions.

You have to go back to the early 1930s, when Baa corporates yielded 700 basis points over Treasuries, to find a comparable situation. And notwithstanding all the hyperventilation in the media that this is worst financial crisis since the Great Depression, there’s never been such a full-court response to the threat of debt deflation — the $700 billion TARP, the bailout of Fannie Mae and Freddie Mac, the likelihood of trillion-dollar deficits and a doubling in the Federal Reserve’s balance sheet in just over two months.

I know things are bad in the corporate bond market, but I didn’t think it was that bad. This made me ask, “Hmm… what about my stocks versus bonds model?” That article is one of my better ones; a lot of time and effort got poured into that. So, I sat down and re-engineered the model, since, embarrassingly, the original model was lost.

The key question is whether the yield on BBB corporates is more than 3.9% higher than the earnings yield on the S&P 500. The answer is yes, and that means we should sell stocks and buy corporate bonds. But, here is the embarrassing thing for me. The first recent signal to sell stocks and buy bonds came in mid-August, but since I didn’t track the model regularly, I missed that. Since the original model worked off monthly data, even selling in early September would have preserved a lot of value. It is not as if corporate bonds have done well since August, but they have done much better than the S&P 500.

Here’s a graph summarizing 2008 via my model:

When the green line goes over 3.9%, it is time to buy corporate bonds. That is not a frequent occurrence; this model gives of signals only a few times per decade. Check out my original piece for more details.

So, with that, I offer my conclusions:

  • It is still time to allocate money to corporate bonds versus equities. Where I have flexibility with my own money, I am allocating money away from Equity and to BBB investment grade and high yield corporates.
  • Though there are a lot of reasons to worry, corporate yield spreads discount a lot of trouble.
  • The model indicates a fair value of the S&P 500 at around 700. Uh, I’m not predicting that, but if we hang around at yield levels like this for long, yes, the equity market will adjust to the competition. More likely is the equity market treads water while corporates rally.
  • A caveat I toss out is that all areas of the credit markets where the government is not meddling are disproportionately hurt, because investors are fleeing toward guaranteed areas. Thus, corporates are hurting.
  • College endowments and other investors that hate to buy conventional assets should consider corporates now. It is my bet that a portfolio of low investment grade and junk grade corporates will outperform a 60/40 portfolio of Stocks and T-Notes.
  • If you have the freedom to sell protection on a broad basket of corporates, this might be a good time to do it, when everyone else is scared to death. Time to insure corporate credit, perhaps.
  • One more caveat before I am done. The rule has only been tested on data since 1953. It is not depression-proof. I hope to gather the data from that era and validate the formula, but that will be difficult.

So, be careful out there, and remember that corporate bonds typically do better than stocks in a prolonged bear market for credit. Yield levels like the present typically bode well for corporate bonds versus stocks.

Lunch is for wimps

Lunch is for wimps
It's not a question of enough, pal. It's a zero sum game, somebody wins, somebody loses. Money itself isn't lost or made, it's simply transferred from one perception to another.