It’s been almost four years since the S&P 500 has had a 10% correction. That makes it the second longest such streak since World War II, trailing only the period from 1990 to 1997 that went longer without experiencing a double digit loss.
Bonds, however, the investor’s go-to asset class for safety, have experienced two separate corrections of 10% or more in that time when looking at long-term U.S. treasury bonds. In fact, long bonds are in the midst of a correction as we speak because interest rates have finally risen over the past couple of months.
Using Ibbotson data on long-term U.S. treasuries going back 1926*, I looked back at the historical corrections to see how often they experienced double digit losses. From 1926-1957 there were actually none, but they did come close a few times:
- -9% in 1931
- -8% in 1939
- -8% in 1951-1953
- -9% in 1954-1957
It wasn’t until 1958 that a double digit correction finally took place in long-term treasuries. Here are each of the drawdowns since then:
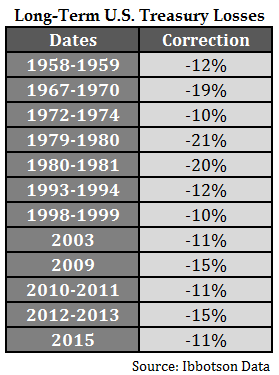
Roughly one out of every five years there has been a double digit correction in the long bond with an average loss of almost 14%. Another was to look at it this is that over 40% of all double digit bond market losses have come since 2003 alone. Why is this the case? It could be that investors are losing patience and trading more often, increasing short-term volatility in a long-term asset. Or it could be that bond market volatility picks when interest rates are lower, especially in long maturity bonds. It’s probably a little of both.
But why were there no large corrections in the 1926-1957 time frame?
I reached out a reader who’s my resident market historian to ask for his take on the pre-World War II lack of large losses in treasuries. Here’s what he had to say:
My understanding is that until the mid-1950s, Treasuries were much less volatile than they have been since then. From 1942-1951 long bonds were pegged by the Fed at around 2.25% yield. But before then, during 1926-1941, Treasuries just didn’t react very much to bubbles and crashes in stocks. Apparently under the gold standard, bond investors regarded long-term prices as stable, and took little heed of short-term economic and price trends.
Even though these are long-term assets, it seems that there are now more momentum investors and macro traders than ever trying to play this space. The chase for yield has also caused many investors to increase the duration in their bond holdings to earn more income. The current state of interest rates doesn’t necessarily means bonds are in a bubble as many presume, but it does mean losses are more likely to occur than they have in the past.
If you’re invested in longer maturity bonds you have to understand the risks involved. All else equal, volatility in bond prices from interest rate moves is higher the longer you go out on the maturity and duration spectrum and the lower the level of interest rates.
For example, the duration of the iShares 20+ Year Treasury Bond ETF (TLT) is currently 17.1 while the duration for 7-10 Year ETF (IEF) is only 7.6. This means you could expect a 1% rise in interest rates to lead to something approaching a 17.1% decline in TLT prices, but just a 7.6% fall in the IEF price (this doesn’t include the income earned on these funds).
None of these historical drawdowns come close to matching the worst historical bear markets in stocks, but they’re probably larger than most bond investors would care to sit through.
It’s worth remembering that a higher yield can lead to higher risk.

No comments:
Post a Comment