Yesterday, Bloomberg published a provocative article indicating that 47% of Nasdaq stocks were currently in bear markets, i.e., at least 20% off of their 52-week high. As stats wonks, we are attracted to these types of studies (and a little jealous when someone else discovers them). Thus, we were immediately intrigued by the article and the data point, particularly as, on the surface, it appeared to lend evidence to the thinning market meme that we have been describing.
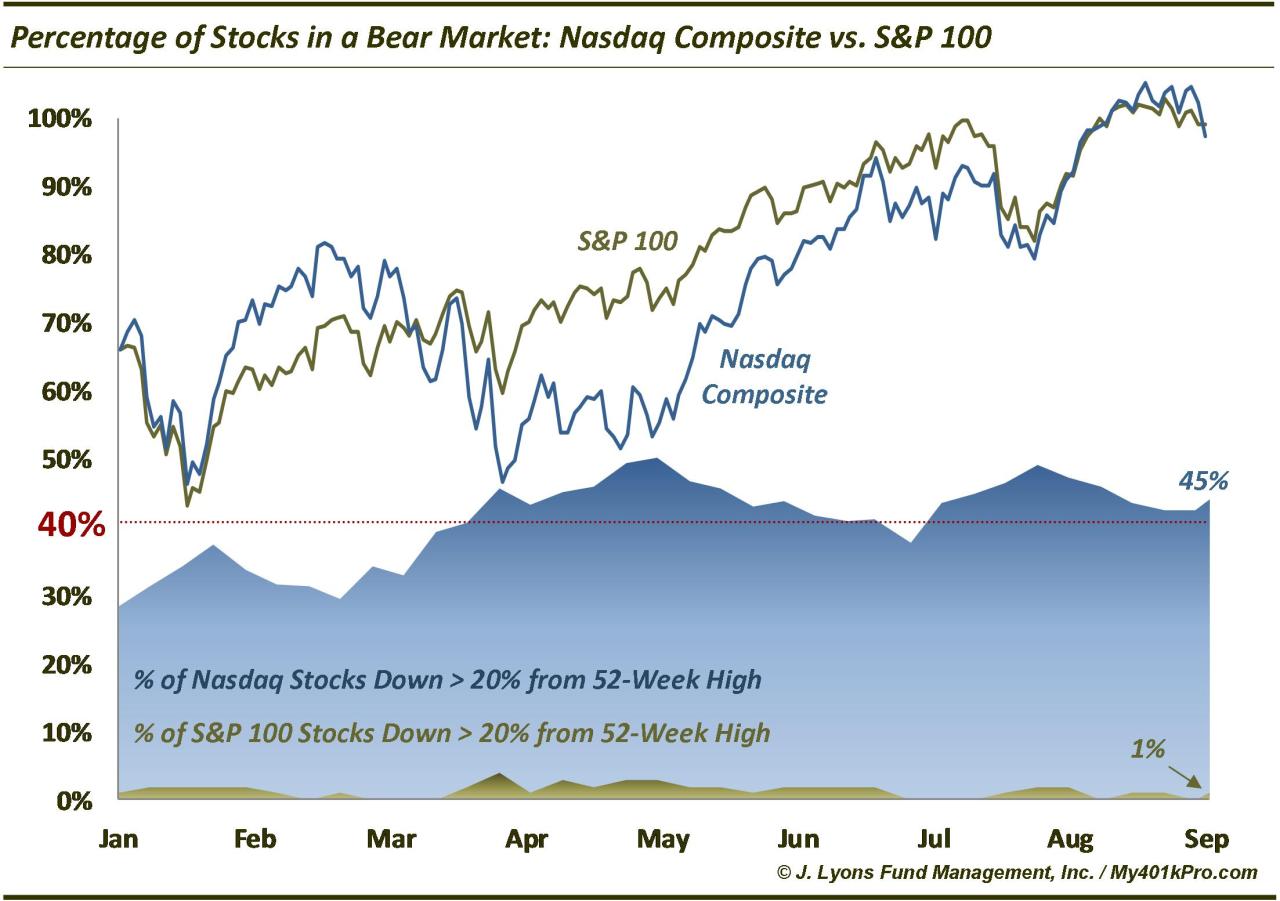
The first step was to run the test to independently verify the 47% figure. We did so and found around 45% of Nasdaq stocks were down 20% from their 52-week high — close enough. Suffice it to say that sounds like an alarmingly high number.
That leads us to the second step: determining context. 47% sounds high but is it really? Well, we ran the test since the beginning of the year and as it turns out, the percentage has been above 40% for most of the time since March. So it may be high, but it isn’t an extremely recent development. If it is one of those divergences that we’ve observed so often lately, it is apparently another one that can persist for some time before causing real damage to the major averages.
Speaking of major averages, one of the takeaways from this study is how the averages can mask broad weakness throughout the market. Due naturally to their high weighting, the biggest stocks by market cap can keep the averages afloat, or rising, if they are doing well — even as much of the broad market is mired in a bear market.
More evidence of that effect is seen from the other series on the chart. Measuring the percentage of stocks in the S&P 100 (the very largest companies) that are in a bear market, we get exactly 1%, i.e., 1 stock (it is General Motors, if you are wondering). That is testament to the strength of the large caps and the resilience of the major averages. It also speaks to another takeaway from this study: stick with the relative strength leaders.
Lastly, to truly determine the significance and context of this statistic, we would have to view its historical data. In the article, Bloomberg mentioned that the number of Nasdaq stocks in a bear market in October 2007 was “about 45%”. However, since we do not have data with timely constituent changes for the Nasdaq going back several years, we cannot generate historical numbers. We could theoretically reproduce it by rebuilding the Nasdaq week-by-week, but that would be too time-consuming a task for us. It would be great if anyone had the data and could share the figures or chart so that we could get a true historical perspective.

No comments:
Post a Comment