Risk Parity funds enjoyed notable fundraising success between 2008 and mid-2013. Investors found the funds’ concept of making money throughout market cycles, whether high or low growth, inflation or deflation, to be quite compelling following the Financial Crisis, only to be surprised midway through last year by an environment unfavorable to investors with exposures to both nominal rates and commodities.
Some see Risk Parity strategies as a valid inclusion in a diversified portfolio, while detracting views range from fundamentally flawed to downright dangerous . What role, then does this strategy have to play? The lively industry discussion, as well as the projected inflows earmarked for these funds (after some outflows in Q1 stemming from 2013’s losses), led us to employ quantitative analysis to take a closer look at some of the characteristics of these enigmatic funds.
We applied MPI’s proprietary Dynamic Style Analysis (DSA) to a set of 40 Act funds employing the strategy and found a surprising disparity between these funds in terms of varying estimated asset exposure and implicit leverage levels. This wide range of risk and exposures defies easy comparison and classification, and warrants investors’ careful consideration when evaluating allocations.
As a brief reminder, the fundamental premise of Risk Parity strategies is that the volatility of returns in traditionally balanced, asset-weighted portfolios is driven almost entirely by the most volatile components, which are typically equities. The argument concludes that traditional portfolios are not sufficiently diversified in different economic environments. Instead, the Risk Parity approach attempts to allocate risk[1] contributions equally between major asset classes (generally including but not limited to stocks, bonds, and commodities), with an expectation the portfolio will provide “attractive, relatively stable” performance throughout different economic regimes.
While the majority of Risk Parity assets are managed in institutional portfolios, some institutional asset managers have made the leap to offering mutual fund versions of their strategy (though current investment minimums may limit retail ubiquity). The frequency of the data and relative transparency of these 40 Act products better lend this small set to a review of the strategy’s implementation. In the analysis that follows, we view seven mutual funds identified as following a Risk Parity strategy[2], looking at their behavior through 2013 and the first quarter of this year, their approach to the Risk Parity model, and what this means for investors who may be analyzing these funds.
The chart below shows the total performance and Max Drawdown of the seven funds over the course of 2013 against the background of their combined World Allocation and Tactical Allocation peers, as classified by Morningstar[3]. It can easily be seen that six funds are outliers in terms of both performance and losses realized over the course of the year. Note also that the funds differ significantly from each other, an indication that categorizing and setting behavioral expectations and benchmarks may not be a simple task.
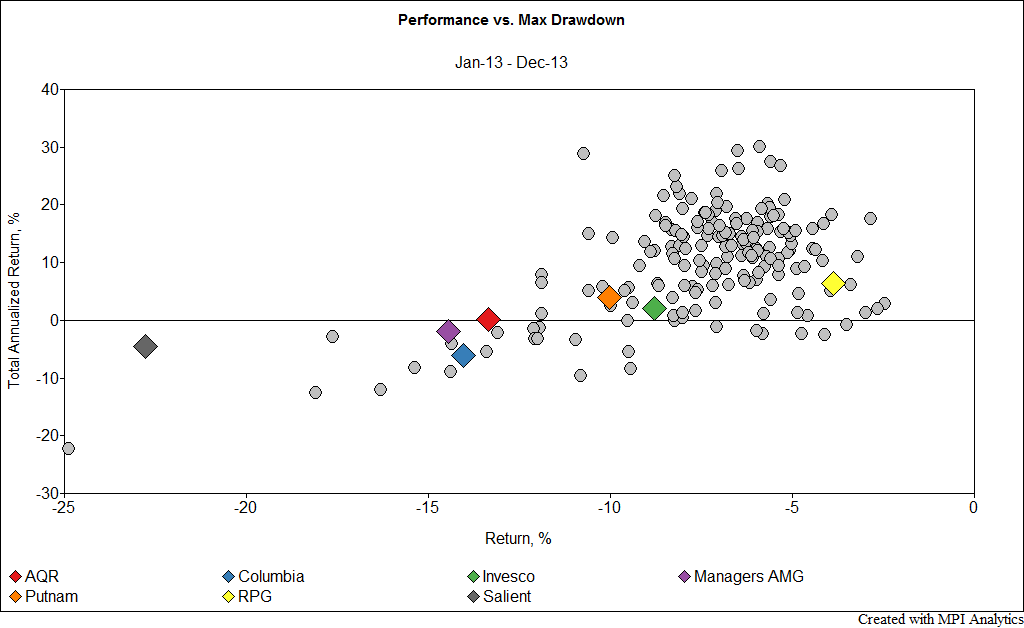
The variance likely results from a wide variety of interpretations and implementations of the same basic premise of equal budgeting between risk factors, and can be further examined through an estimate of the funds’ asset exposures over the course of 2013 and the first quarter of 2014.[4]
Because these are mutual funds, holdings are readily available. This level of transparency is helpful, butit is still often very difficult to determine a fund’s net exposures from point-in-time holdings data. The Putnam fund has over 1000 holdings, according to filings, while the Columbiafund invests in a handful of underlying products, effectively functioning as a fund of funds. DSA can be used to analyze the exposures of the funds over the course of the last 15 months, helping to explain the disparity in their performance by the behavior of their returns and those of a replicating portfolio [5][6] of factor indexes. Here is what we found:
The average exposures[7] over the entire time period, as well as the degree of implied leverage[8] varies greatly between funds.
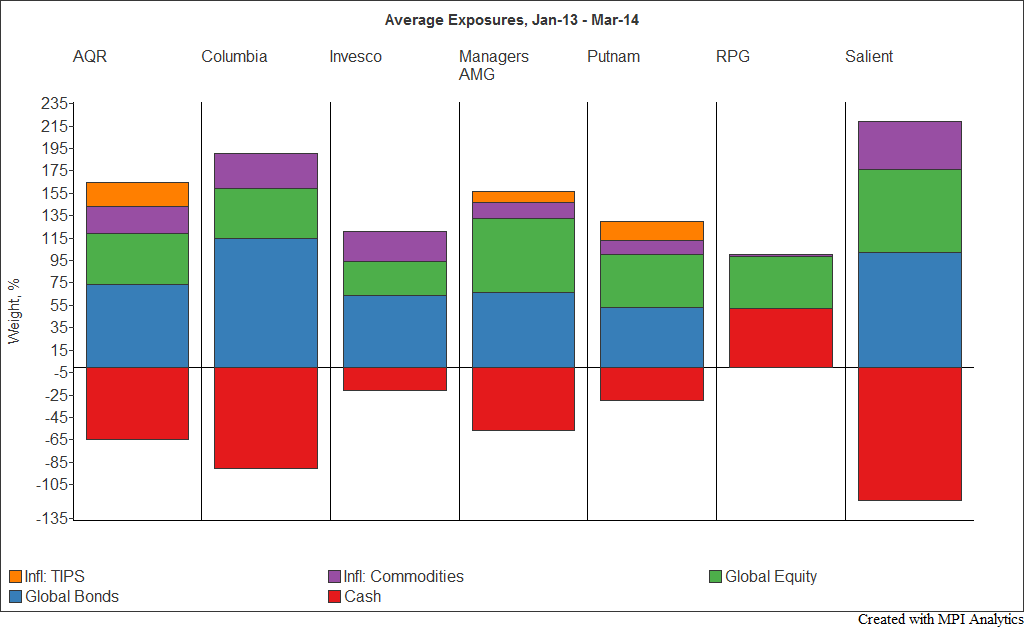
Implied leverage across the group ranges from nonexistent (positive Cash exposure) to over 100%. The gross exposures are clearly disparate, but the relative weights of the asset classes in the portfolio (unlevered and rescaled to 100%) also differ greatly. Exposure to the “Global Bonds basket” ranges from 40% to 60%, while Equity exposures range from just over 20% to greater than 40%. Three of the funds employ TIPS in their “Inflation basket”.
Beyond these broad buckets are major differences in the underlying exposures. For example, some funds seek credit exposure as well as more rate-sensitive government bonds. Some allow investment in emerging markets (either bonds, equities or both) while others only consider developed markets, etc.
A snapshot illustrates the difference in average exposures, but a review of the dynamics of the exposures over the past 15 months shows even greater differences in the funds’ perceived approaches to the strategy[9].
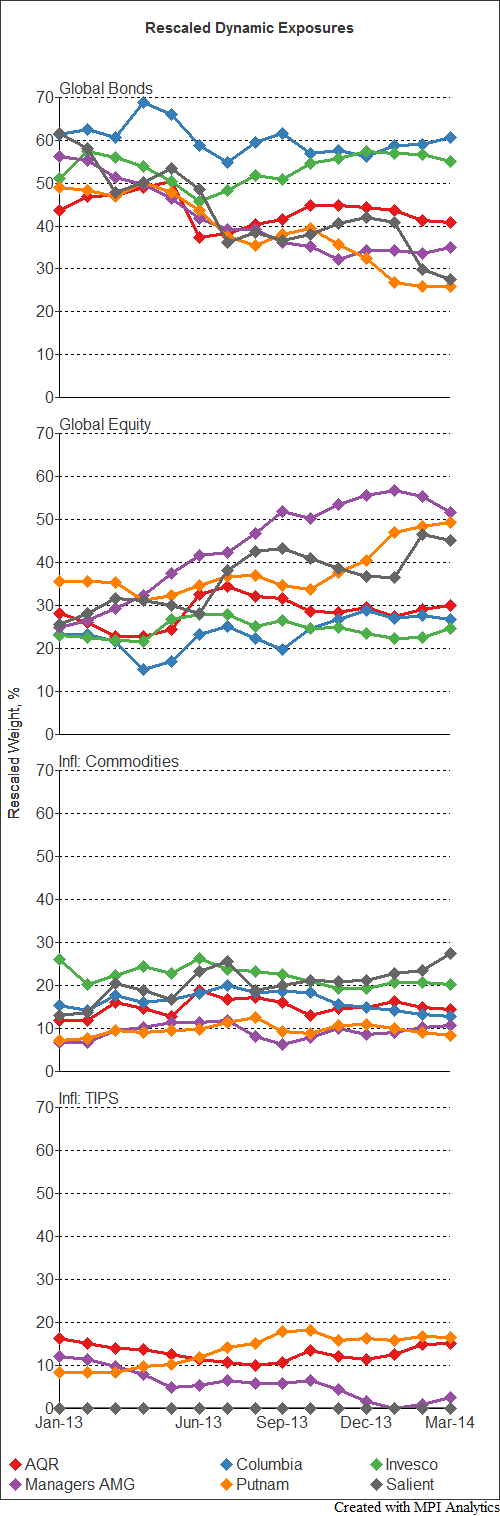
As could be expected given volatility levels following Bernanke’s “Taper Talk” in May, there is a general downward trend in Global Bonds exposure since the beginning of 2013 though the degree of change is not universal. Several funds’ exposures are estimated to have remained relatively steady, with only a minor decrease, while the Salient fund’s & the Putnam fund’s exposure estimates to Global Bonds are approximately half what each was a year ago.
There is a corresponding increase in equity exposure for most funds, but again the degree to which this occurs is broad, with AMG showing the largest increase in Equity exposure.
Comparatively, relative Commodities exposures remain fairly steady, although there is a notable increase in Salient’s estimated exposure. Estimated allocations to TIPS, the other portion of the inflation basket, all move in different directions, with the Putnam fund doubling its exposure, the AMG fund reducing its exposure, while the AQR funds’ exposure remains relatively steady.
Not readily apparent from the chart above is that in terms of overall relative exposures, the AQR, Invesco and Columbia funds remain fairly consistent, while the others appear to engage in much more dynamic allocation over the period.
Conclusion
The bottom line is that these seven Risk Parity mutual funds demonstrate – by the behavior of their returns and common exposures – that there is significant room for interpretation in the same nominal strategy. These quantitative incongruities potentially reflect vastly different philosophies and execution on the part of product providers. As our analysis shows, there does not appear to be a risk level that is common to our sample of funds; the exposure charts showcase how ostensibly differing estimates of future volatilities of various asset classes can lead to substantially different portfolios and performance.
Absent these differences from a quantitative standpoint, the fledgling 40 Act group also lacks unanimity in market classification, with four of the funds classified in the Morningstar Tactical Allocation category, two in the Morningstar World Allocation category, and another lives in the Multialternative category. As the discussion continues, investors should take the time to carefully analyze these funds before making investment decisions and setting expectations.
[1] Most often defined as standard deviation of returns
[2] Morningstar does not currently have a distinct category for Risk Parity funds. As such, the seven are manually selected. Some families offer multiple funds (usually with different risk targets), however only a representative fund was selected from each family. The funds are: AQR Risk Parity I, Columbia Risk Allocation A, Invesco Balanced Risk Allocation A, Managers AMG FQ Global Risk-Balanced , Putnam Dynamic Risk Allocation A, RPG Diversified Risk Parity A, Salient Risk Parity I.
[3] Four of the funds are in the Morningstar Tactical Allocation category, and two are in the Morningstar World Allocation category, while one is in the Multialternative category.
[4] DISCLAIMER: MPI conducts performance-based analyses and, beyond any public information, does not claim to know or insinuate what the actual strategy, positions or holdings of the funds discussed are, nor are we commenting on the quality or merits of the strategies. This analysis is purely returns-based and does not reflect insights into actual holdings. Deviations between our analysis and the actual holdings and/or management decisions made by funds are expected and inherent in any quantitative analysis. MPI makes no warranties or guarantees as to the accuracy of this statistical analysis, nor does it take any responsibility for investment decisions made by any parties based on this analysis.
[5] This analysis was performed using the same factors and parameters for all seven funds in order to provide a basis comparison. Please note that this is not the best combination for any individual fund. Specific exposure estimates will differ when an individually selected set of factors and parameters is applied to each fund. Based on filings, factors relevant to some funds, (e.g. Credit Default Swaps and Foreign Currencies) have been excluded in the interests of using factors common to most of the funds. As well, we have only allowed for leverage whereas some funds allow for short positions.
[6] The average Predicted R2 value for the six funds is 86%. Beyond fit, Predicted R2 is a measure of our confidence in the predictive value of the analysis. The two funds with the lowest values, and therefore degree of confidence are the Salient and RPG funds, both of which have missing factors unique to each fund, according to filings.
[7] Individual exposure estimates are aggregated into the three typical “risk baskets” considered by Risk Parity funds, with the Inflation basket split between Commodities and TIPS due to their vastly different behavior. Each of these baskets comprises a number of underlying factors.
[8] Implicit leverage does not necessarily represent a literal degree of leverage. It is one indication of the relative ‘riskiness’ of the funds, and can be interpreted as the degree of leverage which would have needed to be applied to most closely replicate each fund’s behavior with the factors used in the analysis. Actual leverage may be greater or less than that implied by the replicating portfolio.
[9] RPG, with most of its exposure attributed to Global Equities, has been removed from this chart in order to prevent rescaling that would hide the dynamics of the other six funds.

No comments:
Post a Comment