Yet, it must be noted that this limited and shallow correction arrived much later than it was anticipated by most market participants. As well, the S&P 500 has almost totally made back what it lost.
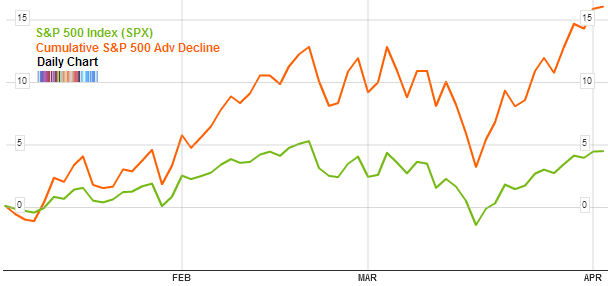
If we look behind the headline numbers of the S&P 500 index, the same underlying strength that we’ve seen for quite some time is evident. The cumulative advance decline line for the S&P 500 index which is a broad measure of strength has already surpassed its February highs and gone on to make new highs:

This indicator has been consistently signalling in the strongest way possible that this is a strong and healthy bull market. As long as we continue to see the average individual stock rise higher and higher, there is a low probability that the bull market will fool us and die suddenly.

Instead, the fact that the cumulative advance decline line for the broad index continues to lead the actual index itself (as it has for several months now) speaks to the longevity of this bull market. No one can make predictions about how long this condition will last. But what we do know is that we are still within ‘normal’ parameters based on historical bull market ages.
Tomorrow or next week the market might crash or enter into a bear market but that type of action would be very rare based on the characteristics that we’ve observed in previous cycles. Usually we received an early warning from this and other similar breadth indicators. This can be as short as a few weeks or as long as a few months. But the fact remains that no such pattern is present and in its stead, we have a clear indication of market strength.

No comments:
Post a Comment