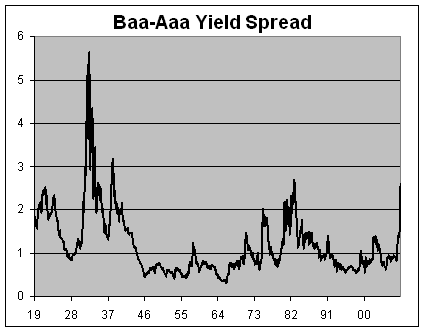
Here’s a fascinating look at corporate bond yields over the past 90 years. I got the data off the Federal Reserve Bank of St. Louis’ data bank. This chart shows the yields of Moody’s index of Aaa and Baa seasoned corporate bond yields.

You’ll notice that the gap has widened significantly. This signifies what we already know, that lenders have become extremely risk-averse. Here’s a look at the difference between the two yields:

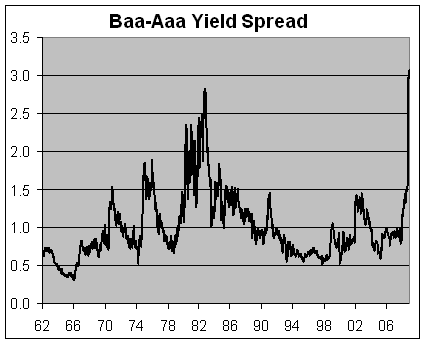
The premium for high-quality lenders is as high as it’s been since the recession of the early 1980s. We’re still a long way from the spreads we had during the Great Depression.
That data series is based on monthly averages, so to zoom in a little, let's look at the weekly data which begins in 1962.


No comments:
Post a Comment