The richest one percent of this country owns half our country's wealth, five trillion dollars. One third of that comes from hard work, two thirds comes from inheritance, interest on interest accumulating to widows and idiot sons and what I do, stock and real estate speculation. It's bullshit. You got ninety percent of the American public out there with little or no net worth. I create nothing. I own.
Monday, January 16, 2012
The Treasury Rally that Keeps on Trucking
The WSJ reports on the Treasury Rally that Won't Die:
According to investment-research firm Morningstar, a portfolio of U.S. Treasurys with an average maturity of 20 years—the quintessential safe haven—rose 28% last year, even better than its 26% jump in 2008. You would have to go back to 1995 to find a better year.
More confusing still: Last year's surge came in the 30th year of a historic rally. Since 1981, long-term Treasury bonds have returned 11.03% annually, 0.05 percentage point better than the Standard & Poor's 500-stock index.
This comes a full year and a half after the WSJ said Treasuries weren't only overpriced, but that we were experiencing The Great American Bond Bubble (my rebuttal 'Bond Bubble Blasphemy' is here, while my rationale for the value of Treasuries at the time can be found here).
One of the charts outlined in my post back then (and updated below, but brought back to 1941 using data from Shiller) shows the takeaway... treasury
rates have been a reflection of the historical growth of nominal GDP
going back 50 years. Before that there was a huge disconnect following
the Great Depression (when nominal GDP dropped by ~50% between 1929 and
1934... yes 50%!) and World War II, which conveniently allowed the U.S.
to grow out of the massive amount of debt the nation had accumulated.
By
this measure, the 3.8% annualized nominal GDP growth over the past ten
years makes the current sub-2% interest rate seem low, but not as much
when you take the following into account:
- Five year annualized GDP growth is only 2.2% (i.e. we are trending down)
- The Fed has made it clear they won't be raising short-term rates anytime soon / they have taken significant Treasury supply out of the market with quantitative easing programs
- Deflationary pressures / potential shocks from Europe remain
- Investors continue to flee risk assets into "safe" assets
So,
does that make me a buyer of Treasuries at these levels? Not
necessarily. I'd rather take a barbell approach to investing by
allocating to return seeking assets on one side (I'll never tell you
where) and cash on the other (for preservation of capital purposes). 2%
is just not worth it for me and the beauty of investing for the average
investor is we don't have to manage our own investments to a benchmark.
That said, I don't think Treasuries are ridiculously priced given the
circumstances.
Source: Federal Reserve / BEA
Friday, January 13, 2012
It’s Not You, It’s Me…..
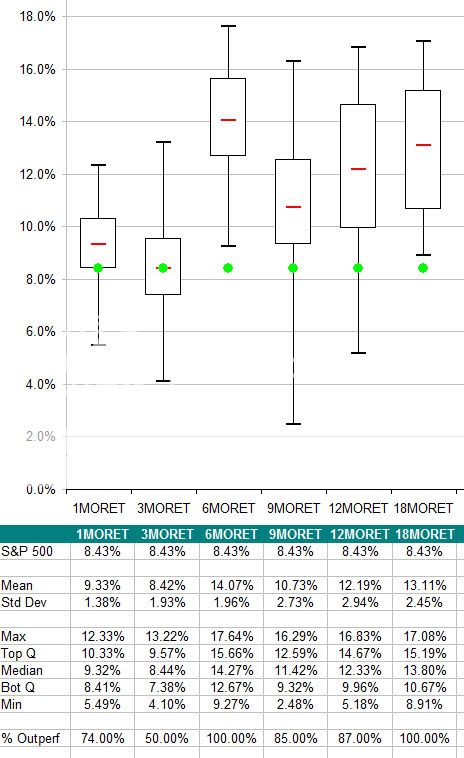
I have been putting data together to update our white papers. It’s no secret that running a Global Tactical Asset Allocation (TAA) strategy was difficult last year. But when I looked at the data it was very clear that the problem wasn’t the strategies. The real problem was how the market behaved during 2011. It’s not you, it’s me. It’s not your trend following strategy, it’s what you’re trying to follow. The market was essentially a psycho, stage 5 clinger last year!
The data I will reference in this post is an extension of the data we published last year in two white papers. If you haven’t read them you can find them here. Our research process for this dataset takes a diverse universe of ETF’s and creates 100 different equity curves for a number of different momentum factors. The universe has a number of different asset classes represented including Equities (Domestic & Foreign), Bonds, Commodities, Currencies, and Real Estate. The results provide a good idea about how a momentum-based, global TAA strategy would have performed. By creating 100 different equity curves we are taking luck out of the equation and showing a realistic range of outcomes from buying high relative strength securities out of our universe.
Most of the momentum factors we follow underperformed last year. The factors we are showing refer to the lookback period to do our rankings. The 1MORET factor (1-month return) means we used 1 month of data to calculate our momentum ranks (all securities are held until they fall out of the top of the ranks, which might be as short as one week or as long as a couple of years). The 12MORET factor uses the prior 12 months of price data to rank the securities. The 3-month factor actually performed the best in 2011, but only 40 out of the 100 trials outperformed the S&P 500, so you needed some luck to outperform. The 6-month factor was the next best, but only 1 trial outperformed so you needed to be really lucky. All the other trials were very poor. There was so much short-term volatility back and forth last year that the very short 1-month formulation period was deadly. It paid not to be too quick on the trigger last year!
(Click To Enlarge)
But looking at 2011 in aggregate doesn’t
really tell the whole story. The beginning of the year was good for
these strategies. That person you were dating held it together pretty
well for the first couple of dates! Through the end of April, most
of the strategies were outperforming the S&P 500 on average. The
6-month factor was doing great as all 100 trials were outperforming.
Ironically, the factor doing the worst was the 3-month factor.
(Click To Enlarge)
The problems for trend following strategies
began in May. There were a series of sharp trend reversals in a number
of different assets: Bonds, Stocks, Precious Metals, Currencies (Yen
& Swiss Franc). No matter what factor you were using from May to
the end of the year it was difficult. It was tough to get traction
anywhere. The only factor that did even so-so was the 3-month factor,
and that was the worst factor through April. That’s just one of many
examples of how crazy the 2011 market was!
(Click To Enlarge)
So where do we go from here? Well, the,
“It’s not you, it’s me…” line always leads to a breakup. That’s
probably not a bad idea when dealing with something that doesn’t change.
Does that psycho, stage 5 clinger ever get any better? Nope. It only
gets worse.
But markets change, and TAA based on
momentum is very adaptive. We will not be in a choppy, range bound
environment forever. Trends will emerge. (If they don’t, it will be the
first time in history.)
Investors were euphoric about
momentum-based TAA strategies in the first part of the year. Looking at
the data you can see why – they were working exceptionally well. After
the last few months, people are certainly not as excited. In reality,
now is the time to be really excited about relative strength strategies,
not back in April. Now is the time you want to be adding money.
Wednesday, January 11, 2012
Understand that Underperformance is Inevitable
"The basic question facing us is whether it’s possible for a superior investment manager to underperform.... The assumption widely held is 'no.' And yet if you look at the records, it’s not only possible, it’s inevitable."
Quote from Wall Street People, by Charles D. Ellis
When faced with short-term underperformance from an investment manager, investors may lose conviction and switch to another manager. Unfortunately, when evaluating managers, short-term performance is not a strong indicator of long-term success.
The study below illustrates the percent of top-performing large cap investment managers from January 1, 2001 to December 31, 2010 who suffered through a three year period of underperformance. The results are staggering:
- 93% of these top managers' rankings fell to the bottom half of their peers for at least one three year period.
- A full 62% ranked among the bottom quartile of their peers for at least one three year period, and
- 31% ranked in the bottom decile for at least one three year period.
Though each of the managers in the study delivered excellent long-term returns, almost all suffered through a difficult period. Investors who recognize and prepare for the fact that short-term underperformance is inevitable—even from the best managers—may be less likely to make unnecessary and often destructive changes to their investment plans.
Source: Davis Advisors. 192 managers from eVestment Alliance’s large cap universe whose 10 year average annualized performance ranked in the top quartile from January 1, 2001–December 31, 2010. Past performance is not a guarantee of future results.
Best performance amongst large hedge funds - 2011
1. Tiger Global, YTD total return: 45% (assets, in billions: 6.0)
2. Renaissance Institutional Equities, 33.1% (7.0)
3. Pure Alpha II, 23.5% (53.0)
4. Discus Managed Futures Program, 20.9% (2.5)
5. Providence MBS, 20.6% (1.3)
6. Oculus, 19.0% (7.0)
7. All Weather 12%, 17.8% (4.4)
8. Dymon Asia Macro, 17.8% (1.6)
9. Citadel, 17.7% (11.0)
10. Coatue Management, 16.9% (4.7)
11. Stratus Multi-Strategy Program, 16.6% (3.7)
12. OxAM Quant Fund, 16.4% (2.0)
13. SPM Core, 15.7% (1.0)
14. Pure Alpha I, 14.9% (11.0)
15. Autonomy Global Macro, 13.9% (2.1)
16. BlackRock Fixed Income Global Alpha, 13.8% (2.4)
17. SPM Structured Serving Holding, 13.5% (1.6)
18. GSA Capital International, 13.0% (1.0)
19. JAT Capital, 12.7% (2.5)
20. Brevan Howard Master, 10.8% (26.4)
2. Renaissance Institutional Equities, 33.1% (7.0)
3. Pure Alpha II, 23.5% (53.0)
4. Discus Managed Futures Program, 20.9% (2.5)
5. Providence MBS, 20.6% (1.3)
6. Oculus, 19.0% (7.0)
7. All Weather 12%, 17.8% (4.4)
8. Dymon Asia Macro, 17.8% (1.6)
9. Citadel, 17.7% (11.0)
10. Coatue Management, 16.9% (4.7)
11. Stratus Multi-Strategy Program, 16.6% (3.7)
12. OxAM Quant Fund, 16.4% (2.0)
13. SPM Core, 15.7% (1.0)
14. Pure Alpha I, 14.9% (11.0)
15. Autonomy Global Macro, 13.9% (2.1)
16. BlackRock Fixed Income Global Alpha, 13.8% (2.4)
17. SPM Structured Serving Holding, 13.5% (1.6)
18. GSA Capital International, 13.0% (1.0)
19. JAT Capital, 12.7% (2.5)
20. Brevan Howard Master, 10.8% (26.4)
Monday, January 02, 2012
Back to fundamentals in 2012
Imagine playing a football game in a driving rainstorm on a muddy field. Players slip and slide all over the place. The quarterback has trouble throwing the ball. Receivers can't grip thrown balls. Running backs are virtually skating on the field and can only occasionally get good footing. Kickers can't judge the wind as it shifts at a moment's notice.
That was the story of disappointing returns in 2011 for many hedge fund and active investment managers, which I wrote about last week.
Consider the experience of star hedge fund managers like Mark Kingdon and John Paulson, who can be described as the proverbial smartest guys in the room. The Wall Street Journal reported that Kingdon and Paulson were whipsawed by the market action in 2011:
Like other high-profile investors, Kingdon has been whipsawed throughout the year by stock market swings that have been hard to predict, turning on a dime. John Paulson (who had a terrific 2008) has had the most humbling year of his own storied career, with his largest funds sinking in value amid wrong-headed bets on an economic recovery.Indeed, the chart below of the S+P 500 shows that the stock market was trendless in the first half of the year and trendless and marked by extreme volatility in the second half. Investable swings, shown in red, were few in number. Many of the swings seen in the second half, shown in green, lasted less than a week – and woe to anyone who tried to invest on news flow in the second half as whipsaw would be the inevitable result.
2011 was an extremely unfriendly environment for investment managers because politics and policy, not fundamental and economics, drove market returns. The market began to worry about an extreme tail-risk, or black swan, event such as a Lehman-like crisis in the second half of 2011. Every news headline moved the markets and it, in a binary risk on/risk off framework, it was virtually impossible for an investment manager to discern direction.
It is therefore no surprise that managers with the freedom to be long or short performed poorly in 2011 because of the lack of a trend, or direction in the market. On my previous post, I showed that the worst performing hedge fund managers were Market Directional, Equity Hedge, or long-short equity managers, and Fundamental Value.
Bimodal distributions and multiple equilibria
Like the metaphor about the football players, the reason why hedge fund managers had disappointing returns in 2011. The environment was unfriendly to their approach. Like the football players, it didn’t matter how skilled they were, they kept slipping in the rain.
That’s because most managers are trained to focus on fundamentals and economics while largely ignoring politics. In a year where politics and policy decision dominated the investment environment, it is no wonder that managers showed disappointing returns.
Moreover, the investment term “multiple equilibria” or “bimodal distribution” began to pop up in year-end letter to investors. As an example, Pimco manager Vineer Bhansali wrote about this topic in an article entitled Asset Allocation and Risk Management in a Bimodal World. In the article he wrote:For example, the policy risk that pervades the markets today causes high correlations among asset classes and a temperament of “risk on/risk off” among investors. This phenomenon can be traced to the connectedness of markets, the ease by which market participants can access these connected markets, and the speed of assimilation of information in response to political events. (See V. Bhansali, The Ps of Pricing and Risk Management, Revisited, Journal of Portfolio Management, Vol. 36, No. 2, Winter 2010.) This environment creates the possibility of multiple equilibria in the market, as well as trends that move markets between these equilibria, and once settled, restraining forces that trap markets in those equilibria (See V. Bhansali, Market Crises -- Can the Physics of Phase Transitions and Symmetry Breaking Tell Us Anything Useful?, Journal of Investment Management, 2009).Even though predicting which force will win is next to impossible given the real-time evolution of the interaction between markets and policy, we can still ask an important question: What would happen if the distribution of returns from a hypothetical portfolio looked more like the one shown in the chart on the right of Figure 1, i.e. a “bimodal” distribution with more than one peak? The bimodal distribution has two peaks, and interestingly, even though it is generated as the result of mixing two normal distributions, each from a different regime, it can exhibit both fat tails (a higher probability of larger losses due to unusual events results in a “fat tail” on the left side of the distribution curve) and skewness (a lack of symmetry between the left and right sides of the peak).
In other words, classical investment theory posits that investment returns follow a bell-shaped distribution, like the figure above on left. In the current environment where investors oscillate between a “risk-on” and “risk-off” trade, the true distribution may look like one with two peaks like the figure on the right. Under these circumstances, techniques used to manage funds assuming a bell-shaped distribution will not work in a multiple equilibrium world (like 2011).
The outlook for 2012
What happens now? Will the environment of 2011 persist into 2012 and the future?
The market should return to focusing on fundamental and economics in 2012. The financial market was largely driven by European news in 2011 as it was concerned the possibility of a Lehman-like market crash. When the news flow indicated that the Financial Apocalypse might be near, stocks sold off. When the European governments tabled a plan that indicated that the day of execution might be delayed, the markets rallied.
The events of 2008 are instructive for evaluating the current market environment. In 2008, the markets were concerned about the housing collapse and its effects on the markets and economy. Fast forward three years, the problems with the US housing market hasn’t gone away, nor have the concerns about the weakness of the American consumer and his balance sheet. But the fear of another Lehman-like Apocalypse in the United States is gone today.
Similarly, the ECB’s Long-Term Refinancing Operation (LTRO), which offers to lend eurozone banks unlimited amounts of money for up to three years, has largely taken the risk of Lehman-like event off the table. The long term problems of over-indebted eurozone sovereigns, weak European banking system and the competitiveness and productivity gap between Northern and Southern Europe remains.
Is the panic getting overdone? Probably. Given that the ECB has taken the market crash scenario off the table, the markets can now go back to focusing on what matters, such as earnings, growth outlook, interest rates, etc.
Under these circumstances, fundamentally driven investment strategies that depend on traditional techniques such as valuation, growth, momentum and trend spotting are likely to perform better in 2012 and beyond.
Warren Buffett's Berkshire Hathaway Beaten by Flat S&P in 2011
BERKSHIRE HATHAWAY STOCK VS. S&P 500 INDEX
ANNUAL GAINS |
| Year | BRK.A Close | BRK Pct. Change | S&P Close | S&P Pct. Change |
| 2011 | 114,755 | -4.7% | 1257.60 | 0.0% |
| 2010 | 120,450 | +21.4% | 1257.64 | +12.8% |
| 2009 | 99,200 | +2.7% | 1115.10 | +23.5% |
| 2008 | 96,600 | -31.8% | 903.25 | -38.5% |
| 2007 | 141,600 | +28.7% | 1468.36 | +3.5% |
| 2006 | 109,990 | +24.1% | 1418.30 | +13.6% |
| 2005 | 88,620 | +0.8% | 1248.29 | +3.0% |
| 2004 | 87,900 | +4.3% | 1211.92 | +9.0% |
| 2003 | 84,250 | +15.8% | 1111.92 | +26.4% |
| 2002 | 72,750 | -3.8% | 879.82 | -23.4% |
| 2001 | 75,600 | +6.5% | 1148.08 | -13.0% |
| 2000 | 71,000 | +26.6% | 1320.28 | -10.1% |
| 1999 | 56,100 | -19.9% | 1469.25 | +19.5% |
| 1998 | 70,000 | +52.2% | 1229.23 | +26.7% |
| 1997 | 46,000 | +34.9% | 970.43 | +31.0% |
| 1996 | 34,100 | +6.2% | 740.74 | +20.3% |
| 1995 | 32,100 | +57.4% | 615.93 | +34.1% |
| 1994 | 20,400 | +25.0% | 459.27 | -1.5% |
| 1993 | 16,325 | +38.9% | 466.45 | +7.1% |
| 1992 | 11,750 | +29.8% | 435.71 | +4.5% |
| 1991 | 9,050 | +35.6% | 417.09 | +26.3% |
| 1990 | 6,675 | -23.1% | 330.22 | -5.8% |
| 1989 | 8,675 | +84.6% | 350.67 | +26.3% |
| 1988 | 4,700 | +59.3% | 277.72 | +12.4% |
| 1987 | 2,950 | +4.6% | 247.08 | +2.0% |
| 1986 | 2,820 | +14.2% | 242.17 | +14.6% |
| 1985 | 2,470 | +93.7% | 211.28 | +26.3% |
| 1984 | 1,275 | -2.7% | 167.24 | +1.4% |
| 1983 | 1,310 | +69.0% | 164.93 | +17.3% |
| 1982 | 775 | +38.4% | 140.64 | +14.8% |
| 1981 | 560 | +31.8% | 122.55 | -9.7% |
| 1980 | 425 | +32.8% | 135.76 | +25.8% |
| 1979 | 320 | +110.5% | 107.94 | +12.3% |
| 1978 | 152 | +10.1% | 96.11 | +1.1% |
| 1977 | 138 | +55.1% | 95.10 | -11.5% |
| Average | +26.5% | +8.6% |

Vitaliy Katsenelson on Krugman’s Missed Call
Vitaliy Katsenelson, CFA, is chief investment officer at Investment
Management Associates, Inc., a Denver-based money management
firm. Vitaliy is also the author of the highly acclaimed books The Little
Book of Sideways Markets (Wiley, 2010) and Active Value Investing:
Making Money in Range Bound Markets (Wiley, 2007). His web site is
Contrarian Edge.
Paul Krugman wrote about China in his New York Times column last Monday. That’s a topic that you have researched closely. He said that "China’s story just sounds too much like the crack-ups we’ve already seen elsewhere," referring to the financial crisis in the US and the Japanese lost decade. Do you agree with his assessment?
Yes. You can draw a lot of parallels between the Japanese and US real estate bubbles. But China’s bubble is much larger; it spreads beyond residential real estate to commercial real estate, the industrial sector, and infrastructure. Also, though there were government fingerprints on the US and Japanese real estate bubbles, the Chinese real estate bubble was directly and entirely caused by the Chinese government.
The Chinese bubble has been inflating for years. It should have popped during 2008 recession. But China fire-hosed a stimulus equal to 12% of its GDP into its economy and was able to keep the bubble growing.
When is it going to pop? It has already begun. You see sales volumes and prices plummeting at double-digit rates in second-tier cities.
I agree with Krugman’s assessment. What perplexes me is why the Nobel Prize-winning economist wrote this column now, when the problems he describes are plain for all to see, and not a few years ago. You’d think he would have been alarmed over the consequences of monstrous government intervention in an economy the size of China’s. But perhaps Krugman, who describes himself as a liberal economist, secretly hoped that the Chinese government would be able to manage the economy better than the free market.
Paul Krugman wrote about China in his New York Times column last Monday. That’s a topic that you have researched closely. He said that "China’s story just sounds too much like the crack-ups we’ve already seen elsewhere," referring to the financial crisis in the US and the Japanese lost decade. Do you agree with his assessment?
Yes. You can draw a lot of parallels between the Japanese and US real estate bubbles. But China’s bubble is much larger; it spreads beyond residential real estate to commercial real estate, the industrial sector, and infrastructure. Also, though there were government fingerprints on the US and Japanese real estate bubbles, the Chinese real estate bubble was directly and entirely caused by the Chinese government.
The Chinese bubble has been inflating for years. It should have popped during 2008 recession. But China fire-hosed a stimulus equal to 12% of its GDP into its economy and was able to keep the bubble growing.
When is it going to pop? It has already begun. You see sales volumes and prices plummeting at double-digit rates in second-tier cities.
I agree with Krugman’s assessment. What perplexes me is why the Nobel Prize-winning economist wrote this column now, when the problems he describes are plain for all to see, and not a few years ago. You’d think he would have been alarmed over the consequences of monstrous government intervention in an economy the size of China’s. But perhaps Krugman, who describes himself as a liberal economist, secretly hoped that the Chinese government would be able to manage the economy better than the free market.
But even over the last few years China’s growth has remained relatively strong –
certainly as compared to the rest of the world – just not as strong as it was in the
years prior to that.
It was completely driven by fixed-asset investment and the bad loans that came with that – not a sustainable type of growth.
One of the things Krugman pointed to was the lack of reliable data from the Chinese government. To what extent does that cloud your analysis, and how certain can you be in your forecast and your analysis, given the uncertainty, or unreliability, of Chinese government data?
He is right. When you look at Chinese government data, it has a couple of biases. Number one is in the way they collect data: it comes from municipalities and local governments that are given growth targets. The federal government says, “You need to grow, let's say 10% of GDP per capita, for your municipality.” The local bureaucrat has to get that growth. The easiest way to do it is to build, and that is why they have had a real estate bubble.
But the problem is, if the local bureaucrats fail to deliver the growth they know they'll lose their jobs. So they start cooking the numbers, and they start sending numbers to the top that are falsified. That is the number one bias.
The second bias is that this is a government that is very concerned about its image. It is very good at propaganda. The government puts people in jail for writing anti-government articles. The economic statistics are the output of a propaganda machine. You truly can't trust the data coming from the government.
But that is why you look at anecdotal evidence, and the data points they can't or just don't bother to cook. During the 2008-2009 recession, the global economy was contracting and the Chinese government was showing that GDP was growing at a fairly healthy pace. However, other data points, like the tonnage of goods shipped through railroads, were down by double digits. Electricity consumption declined too.
Eventually, we started seeing empty cities popping up here and there.
What made it easy for me to understand China is that I was raised in Soviet Russia for the first half of my life. This experience helped me to understand how inefficient, dysfunctional, and corrupt an economy that is run by the government can be. You start seeing and piecing together the small bits of anecdotal evidence. You build a framework that helps you to understand their economy.
It was completely driven by fixed-asset investment and the bad loans that came with that – not a sustainable type of growth.
One of the things Krugman pointed to was the lack of reliable data from the Chinese government. To what extent does that cloud your analysis, and how certain can you be in your forecast and your analysis, given the uncertainty, or unreliability, of Chinese government data?
He is right. When you look at Chinese government data, it has a couple of biases. Number one is in the way they collect data: it comes from municipalities and local governments that are given growth targets. The federal government says, “You need to grow, let's say 10% of GDP per capita, for your municipality.” The local bureaucrat has to get that growth. The easiest way to do it is to build, and that is why they have had a real estate bubble.
But the problem is, if the local bureaucrats fail to deliver the growth they know they'll lose their jobs. So they start cooking the numbers, and they start sending numbers to the top that are falsified. That is the number one bias.
The second bias is that this is a government that is very concerned about its image. It is very good at propaganda. The government puts people in jail for writing anti-government articles. The economic statistics are the output of a propaganda machine. You truly can't trust the data coming from the government.
But that is why you look at anecdotal evidence, and the data points they can't or just don't bother to cook. During the 2008-2009 recession, the global economy was contracting and the Chinese government was showing that GDP was growing at a fairly healthy pace. However, other data points, like the tonnage of goods shipped through railroads, were down by double digits. Electricity consumption declined too.
Eventually, we started seeing empty cities popping up here and there.
What made it easy for me to understand China is that I was raised in Soviet Russia for the first half of my life. This experience helped me to understand how inefficient, dysfunctional, and corrupt an economy that is run by the government can be. You start seeing and piecing together the small bits of anecdotal evidence. You build a framework that helps you to understand their economy.
Are there any policy options that are still available to the Chinese government, for
example, stimulus measures that it could take to avert the kind of crisis that
Krugman predicts and that you say is already occurring?
I am fairly certain that, once the pain of economic slowdown is felt, the government will do what it did in 2008: It will try to re-inflate the bubble. But that will add another layer of future problems on top of the existing ones. For instance, according to Pivot Capital, toxic shadow banking, which was almost nonexistent in 2008, is estimated to be $250 billion in 2011. The Chinese government may manage to keep the bubble from bursting for a little longer, but at some point the basic laws of economics will assert themselves, and there is absolutely nothing the Chinese will be able to do.
What will be the spillover effect in the United States?
This is very interesting. Look at what is going on in Europe today. Let's say the euro will not blow up. In other words, Europe is still going to have a monetary union consisting of the same 17 members going forward, but a byproduct of that will be austerity, and they will consume less. We are going to sell fewer goods to Europe. Europe will be consuming fewer goods from Japan and from China. So what happens in Europe could accelerate what is already happening in China, and that may hasten the bursting of its bubble.
Japan’s largest trading partner is not the United States, but China. (China accounts for of 19.4% of Japanese exports; the US is only 15.7%.) We are all concerned about Europe, but Japan is in much worse shape than Europe. Italy has debt-to-GDP of 120% and it is paying 7% for its 10-year bonds, while Japan’s debt-to-GDP is over 200% and its 10-year bonds yield less than 1%. Japan has even worse demographics than Europe, which is hard to imagine. The Japanese government was able to amass an enormous pile of debt because it borrowed internally from its citizens, who had a very high savings rate. The savings rate, however, has declined over the last decade as Japanese society ages. The economic crisis in China will likely cause much higher unemployment in Japan and thus a further decline in the savings rate.
Suddenly, the Japanese government will have to borrow money externally, and US and European investors will not be buying Japanese 10-year bonds for 1%, I assure you. Even bigger budget deficits will result – and Japan is already running 8% shortfalls – or the Japanese will print money, which will cause huge inflation. Most likely, both will be the case.
China may accelerate the bursting of the Japanese debt bubble. The Japanese bubble has been developing for a long time. We may see contagion in ways we haven’t seen before. Of course, the obvious consequences are in the area of industrial commodities. Because China builds so much, it consumes a lot of them, and their prices will plummet. Also, commodity-exporting countries (Australia, Brazil, and others) that appear immune to
I am fairly certain that, once the pain of economic slowdown is felt, the government will do what it did in 2008: It will try to re-inflate the bubble. But that will add another layer of future problems on top of the existing ones. For instance, according to Pivot Capital, toxic shadow banking, which was almost nonexistent in 2008, is estimated to be $250 billion in 2011. The Chinese government may manage to keep the bubble from bursting for a little longer, but at some point the basic laws of economics will assert themselves, and there is absolutely nothing the Chinese will be able to do.
What will be the spillover effect in the United States?
This is very interesting. Look at what is going on in Europe today. Let's say the euro will not blow up. In other words, Europe is still going to have a monetary union consisting of the same 17 members going forward, but a byproduct of that will be austerity, and they will consume less. We are going to sell fewer goods to Europe. Europe will be consuming fewer goods from Japan and from China. So what happens in Europe could accelerate what is already happening in China, and that may hasten the bursting of its bubble.
Japan’s largest trading partner is not the United States, but China. (China accounts for of 19.4% of Japanese exports; the US is only 15.7%.) We are all concerned about Europe, but Japan is in much worse shape than Europe. Italy has debt-to-GDP of 120% and it is paying 7% for its 10-year bonds, while Japan’s debt-to-GDP is over 200% and its 10-year bonds yield less than 1%. Japan has even worse demographics than Europe, which is hard to imagine. The Japanese government was able to amass an enormous pile of debt because it borrowed internally from its citizens, who had a very high savings rate. The savings rate, however, has declined over the last decade as Japanese society ages. The economic crisis in China will likely cause much higher unemployment in Japan and thus a further decline in the savings rate.
Suddenly, the Japanese government will have to borrow money externally, and US and European investors will not be buying Japanese 10-year bonds for 1%, I assure you. Even bigger budget deficits will result – and Japan is already running 8% shortfalls – or the Japanese will print money, which will cause huge inflation. Most likely, both will be the case.
China may accelerate the bursting of the Japanese debt bubble. The Japanese bubble has been developing for a long time. We may see contagion in ways we haven’t seen before. Of course, the obvious consequences are in the area of industrial commodities. Because China builds so much, it consumes a lot of them, and their prices will plummet. Also, commodity-exporting countries (Australia, Brazil, and others) that appear immune to
the tornadoes sweeping through the global economy will suffer. It is very likely that we’ll
see much higher global interest rates.
The collapse of Chinese residential real estate will make a lot of Chinese angry. The Chinese government set bank interest rates at below-inflation levels, thus pushing its citizens into becoming real estate speculators. A collapse in real estate prices will wipe out a huge chunk of generational wealth and may cause political unrest. We are seeing a lot of stories already of people who bought homes and condos, lost 30% in just a few months, and are now storming offices of real estate developers to demand refunds.
Let's turn to Europe. Do you see an inevitable outcome for that region in terms of how it will resolve the crisis over the euro and its member nations’ sovereign debt?
There is a very high probability that the European Union will become more fiscally integrated. This crisis will bring them closer, not pull them apart.
It is like getting married and having 20 children – it is very difficult to get divorced. If the monetary union falls apart, the weak countries – Spain, Greece, etc. – will suffer tremendously, because if they have to convert back to their own currencies their banking systems will collapse almost overnight. Everybody will rush to the banks to get their money out, which is already happening in Greece to some degree. Their debts will be in euros, and their local currencies will depreciate.
The strong countries will suffer as well, especially Germany, since it is a very large exporter to the rest of Europe. If Germany leaves the European Union, then the deutschemark will appreciate, and it will hurt their economy.
German banks have huge exposure to the rest of Europe. By bailing out Europe, Germany is basically bailing out its own banks. Germany cannot bail out all the weak countries. Germany, because of what happened during the Weimar Republic, does not want to do that, because they fear inflation. They saw what inflation did. But they’ll have little choice.
I never thought I’d say this, but printing money is a lot more democratic than bailing out other countries. I believe Europe will print.
There is a 70% probability that the European countries will become much more fiscally integrated than they were before. However that will be accompanied by austerity. Austerity means government deleveraging, which will bring higher unemployment. At some point you may have people rioting in the streets, as has happened in Greece. I can see people saying, “If being in the monetary union means we don’t have jobs, then we want no part of it.”
The collapse of Chinese residential real estate will make a lot of Chinese angry. The Chinese government set bank interest rates at below-inflation levels, thus pushing its citizens into becoming real estate speculators. A collapse in real estate prices will wipe out a huge chunk of generational wealth and may cause political unrest. We are seeing a lot of stories already of people who bought homes and condos, lost 30% in just a few months, and are now storming offices of real estate developers to demand refunds.
Let's turn to Europe. Do you see an inevitable outcome for that region in terms of how it will resolve the crisis over the euro and its member nations’ sovereign debt?
There is a very high probability that the European Union will become more fiscally integrated. This crisis will bring them closer, not pull them apart.
It is like getting married and having 20 children – it is very difficult to get divorced. If the monetary union falls apart, the weak countries – Spain, Greece, etc. – will suffer tremendously, because if they have to convert back to their own currencies their banking systems will collapse almost overnight. Everybody will rush to the banks to get their money out, which is already happening in Greece to some degree. Their debts will be in euros, and their local currencies will depreciate.
The strong countries will suffer as well, especially Germany, since it is a very large exporter to the rest of Europe. If Germany leaves the European Union, then the deutschemark will appreciate, and it will hurt their economy.
German banks have huge exposure to the rest of Europe. By bailing out Europe, Germany is basically bailing out its own banks. Germany cannot bail out all the weak countries. Germany, because of what happened during the Weimar Republic, does not want to do that, because they fear inflation. They saw what inflation did. But they’ll have little choice.
I never thought I’d say this, but printing money is a lot more democratic than bailing out other countries. I believe Europe will print.
There is a 70% probability that the European countries will become much more fiscally integrated than they were before. However that will be accompanied by austerity. Austerity means government deleveraging, which will bring higher unemployment. At some point you may have people rioting in the streets, as has happened in Greece. I can see people saying, “If being in the monetary union means we don’t have jobs, then we want no part of it.”
Just to be clear, for Europe to remain integrated, does it require what you describe
as “printing more money”? Is that essentially having that ECB buy the bad
sovereign debt that is on the books of the banks?
What we keep learning is that financial geeks are very creative, even more creative than the geeks in the Silicon Valley, and they find vehicles that we didn't even know existed. I never thought the IMF would be able to put in place a bailout mechanism for Europe. But Italy will contribute $23.5 billion to the IMF to bail out itself! I've learned never to underestimate the creativity of financial geeks, and they have a lot of them in Europe.
I have no idea exactly how they are going to print money, but they will figure out a way to do it. It's going to be through the ECB, and through euro-bonds or through some other vehicle that we don't know about yet. We are going to have a much greater money supply in Europe.
Will they avoid inflation, because at the same time they will be undergoing a deep recession?
To some degree they will, because the prices of necessities will go up, and at the same time wages will stagnate or decline (as unemployment rises). So it is very difficult to say right now. You are going to have a much greater money supply, but you don't know what's going to happen to the velocity of money and thus inflation.
Let's turn to the United States. You've written about the fact that the US is in a sideways market. What do you mean by that? More importantly, where are we are now in that cycle and what is the timing, in terms of when we will emerge from the sideways market into either a bull or a bear market?
Think about market cycles in this way. In the long run, stock-price returns come from earnings growth and from change in price-to-earnings ratios. In the very long term, changes in price-to-earnings tend to cancel each other out, so therefore in the very long run stock prices really go up with earnings growth, which equals GDP growth. In the shorter term, a combination of earnings growth and change in the P/E gives you the return for the stock market. You add dividends on top of that, and now you have total stock market returns.
Whenever you have a secular bull market, which lasts about 15 years (plus or minus a few), you have two elements. You have earnings growth and price-to-earnings ratios that are expanding. At the beginning of the bull market, price-to-earnings ratios are very low, let's say seven to 10. By the end of the bull market, the ratio has run through the average to an above-average level, let's say to the 20s.
A sideways market happens at the end of a bull market. Earnings are still growing during a sideways market. P/Es, though, are declining, going from above-average to below-average. Earnings growth and P/E contraction cancel each other out, and this is why the market goes sideways.
What we keep learning is that financial geeks are very creative, even more creative than the geeks in the Silicon Valley, and they find vehicles that we didn't even know existed. I never thought the IMF would be able to put in place a bailout mechanism for Europe. But Italy will contribute $23.5 billion to the IMF to bail out itself! I've learned never to underestimate the creativity of financial geeks, and they have a lot of them in Europe.
I have no idea exactly how they are going to print money, but they will figure out a way to do it. It's going to be through the ECB, and through euro-bonds or through some other vehicle that we don't know about yet. We are going to have a much greater money supply in Europe.
Will they avoid inflation, because at the same time they will be undergoing a deep recession?
To some degree they will, because the prices of necessities will go up, and at the same time wages will stagnate or decline (as unemployment rises). So it is very difficult to say right now. You are going to have a much greater money supply, but you don't know what's going to happen to the velocity of money and thus inflation.
Let's turn to the United States. You've written about the fact that the US is in a sideways market. What do you mean by that? More importantly, where are we are now in that cycle and what is the timing, in terms of when we will emerge from the sideways market into either a bull or a bear market?
Think about market cycles in this way. In the long run, stock-price returns come from earnings growth and from change in price-to-earnings ratios. In the very long term, changes in price-to-earnings tend to cancel each other out, so therefore in the very long run stock prices really go up with earnings growth, which equals GDP growth. In the shorter term, a combination of earnings growth and change in the P/E gives you the return for the stock market. You add dividends on top of that, and now you have total stock market returns.
Whenever you have a secular bull market, which lasts about 15 years (plus or minus a few), you have two elements. You have earnings growth and price-to-earnings ratios that are expanding. At the beginning of the bull market, price-to-earnings ratios are very low, let's say seven to 10. By the end of the bull market, the ratio has run through the average to an above-average level, let's say to the 20s.
A sideways market happens at the end of a bull market. Earnings are still growing during a sideways market. P/Es, though, are declining, going from above-average to below-average. Earnings growth and P/E contraction cancel each other out, and this is why the market goes sideways.
When I say sideways, don’t confuse it with a kind and placid market – there can be a lot of
volatility and a lot of cyclical bear and bull markets embedded in a sideways market. In
fact, the last sideways market, from 1966-1982, included five little bear markets and five
little bull markets – so a lot of volatility.
Finally, you have a third type of secular market. It is the bear market, which happens a lot less often than you would think. Bear markets start with high valuations, which we had in the late 1990s, and prolonged contacting earnings. So you have two negatives, declining earnings and declining P/Es. Together you have very poor returns, because you add two negatives.
Over the last 10 or 11 years earnings have grown and P/Es have contracted, so we've been in a sideways market.
Going forward, are we going to be in a sideways market or a bull market?
This is where I just gave you a framework, and you can use your own assumptions. If we're still going to have positive growth in the long run, then we are still going to be in a sideways market. If we are going to have a contracting economy for a long period of time, however, then all the bets are off and we are in a bear market, as today’s valuations are still high. I am not saying this because I am hedging my bets. This is a very simple framework, and all you have to do is figure out one thing: Are we going to have economic growth, or not?
What is your answer to that question?
In the context of what is going on Europe, China, Japan, and the US, the next decade will be payback time for all the partying the global economy did previously. Our economy will still grow, but at a slower rate.
Actually, let me clarify this: It is the nominal earnings growth rate that really matters. So even if real earnings growth is low, there is a good chance that inflation will pick up and the nominal growth rate will be higher than we are used to. So you have to make an assumption about what will happen to inflation and deflation in the future as well.
The second part is this: How long until the end of the sideways market? This is where it gets tricky. The market is only cheap today because profit margins are still high. Corporate profit margins are about 50% above their average [see the chart below]. Once margins start normalizing (or, in this instance, decline), profits will either stagnate or fall. So the market is not cheap.
Finally, you have a third type of secular market. It is the bear market, which happens a lot less often than you would think. Bear markets start with high valuations, which we had in the late 1990s, and prolonged contacting earnings. So you have two negatives, declining earnings and declining P/Es. Together you have very poor returns, because you add two negatives.
Over the last 10 or 11 years earnings have grown and P/Es have contracted, so we've been in a sideways market.
Going forward, are we going to be in a sideways market or a bull market?
This is where I just gave you a framework, and you can use your own assumptions. If we're still going to have positive growth in the long run, then we are still going to be in a sideways market. If we are going to have a contracting economy for a long period of time, however, then all the bets are off and we are in a bear market, as today’s valuations are still high. I am not saying this because I am hedging my bets. This is a very simple framework, and all you have to do is figure out one thing: Are we going to have economic growth, or not?
What is your answer to that question?
In the context of what is going on Europe, China, Japan, and the US, the next decade will be payback time for all the partying the global economy did previously. Our economy will still grow, but at a slower rate.
Actually, let me clarify this: It is the nominal earnings growth rate that really matters. So even if real earnings growth is low, there is a good chance that inflation will pick up and the nominal growth rate will be higher than we are used to. So you have to make an assumption about what will happen to inflation and deflation in the future as well.
The second part is this: How long until the end of the sideways market? This is where it gets tricky. The market is only cheap today because profit margins are still high. Corporate profit margins are about 50% above their average [see the chart below]. Once margins start normalizing (or, in this instance, decline), profits will either stagnate or fall. So the market is not cheap.
Sideways markets end with lower P/Es, with one important point caveat: P/Es can stay at
below-average levels for a while. Right now, we are at average to slightly above-average
P/E ratios, if you normalize earnings for current profit margins. If you assume that we
need to spend some time at below-average P/E levels, then we still have some pain
ahead. We still have at least five or 10 years of sideways market left before we get to the
below-average P/Es, and we could stay there for a while. So we are not there yet.
But the good news is that once sideways markets end, it is usually bull market time.
You are saying that unusually high profit margins are holding up valuations right now, and that eventually there will be a reversion to the mean. But can't profit margins stay at a high level for a long period of time, just as you said that P/E multiples can remain in a low range for a long period of time? Can't this reversion to the mean occur over a protracted period?
Profit margins usually can’t hang in there as long as P/Es – just a few years. Because when one company starts making abnormal profits, competition comes in and erodes those profits.
But the good news is that once sideways markets end, it is usually bull market time.
You are saying that unusually high profit margins are holding up valuations right now, and that eventually there will be a reversion to the mean. But can't profit margins stay at a high level for a long period of time, just as you said that P/E multiples can remain in a low range for a long period of time? Can't this reversion to the mean occur over a protracted period?
Profit margins usually can’t hang in there as long as P/Es – just a few years. Because when one company starts making abnormal profits, competition comes in and erodes those profits.
Let me give you this example. Apple made terrific iPhone and iPads. Several years later,
there is now a lot of new competition that has introduced products that are almost as good,
or products that are not as good but are much lower-priced (such as Kindle Fire). And
guess what? At some point, Apple, to be competitive, is going to have to lower its prices;
and therefore its profit margins, which are at their highest level ever, will have to decline.
The same thing applies for the economy as a whole, with some exceptions. There are some industries that can maintain high margins for a long period of time. But for the economy overall, competition either forces lower prices or offers products or services that have more features for the same price, and in the end profit margins decline.
Why don't we turn to one of your stock selections. I saw you wrote recently that Microsoft is a company you like. It is also one of Seth Klarman’s holdings. How can it be that a stock as prominent as that, which is followed by as many analysts as it is, can offer the margin of safety that a value investor like you would require?
That’s what is interesting. If I gave you Microsoft’s financial statements and I didn't tell you what company it was, you would say it was an incredible business. The company has more than doubled its earnings over the last five years and has a huge, cash-rich balance sheet, an enormous return-on-capital of nearly 40%, enormous cash-flow generation, and a near-monopoly in a lot of businesses where it operates.
Then you look at the stock price and you say, “Huh, this company hasn't gone anywhere for the last 12 years.” Microsoft, to some degree, is a very typical sideways-market stock. Its P/E was extremely high and its earnings were very high at the end of the last bull market, and its P/E collapsed. Its P/E was 50; and now, if you take out cash, it is at about 6.5 to 7 times earnings. There is a psychological element, where people look at the stock price and are fatigued by the nonperformance of the stock.
But there is another element that is very specific to Microsoft. Even if you take the sideways market psychology into consideration, this company should not be trading at this valuation. Wall Street lost confidence in the company's management. Microsoft’s business was so good that it was able to grow earnings on autopilot.
There is a lot more competition now, like Google and Apple. They are very strong financially. They're dominating their main markets.
The market is saying Microsoft is going to become a dinosaur. It's going to decline into obsolescence. This is where Klarman and I disagree with the consensus.
Look at Windows Vista; it was a horrible product. But it was still a financial success, because Microsoft had a monopoly. Then Windows 7 took over from Windows Vista and fixed it. Windows 7 was not an innovative product, but it was a good solid product.
The same thing applies for the economy as a whole, with some exceptions. There are some industries that can maintain high margins for a long period of time. But for the economy overall, competition either forces lower prices or offers products or services that have more features for the same price, and in the end profit margins decline.
Why don't we turn to one of your stock selections. I saw you wrote recently that Microsoft is a company you like. It is also one of Seth Klarman’s holdings. How can it be that a stock as prominent as that, which is followed by as many analysts as it is, can offer the margin of safety that a value investor like you would require?
That’s what is interesting. If I gave you Microsoft’s financial statements and I didn't tell you what company it was, you would say it was an incredible business. The company has more than doubled its earnings over the last five years and has a huge, cash-rich balance sheet, an enormous return-on-capital of nearly 40%, enormous cash-flow generation, and a near-monopoly in a lot of businesses where it operates.
Then you look at the stock price and you say, “Huh, this company hasn't gone anywhere for the last 12 years.” Microsoft, to some degree, is a very typical sideways-market stock. Its P/E was extremely high and its earnings were very high at the end of the last bull market, and its P/E collapsed. Its P/E was 50; and now, if you take out cash, it is at about 6.5 to 7 times earnings. There is a psychological element, where people look at the stock price and are fatigued by the nonperformance of the stock.
But there is another element that is very specific to Microsoft. Even if you take the sideways market psychology into consideration, this company should not be trading at this valuation. Wall Street lost confidence in the company's management. Microsoft’s business was so good that it was able to grow earnings on autopilot.
There is a lot more competition now, like Google and Apple. They are very strong financially. They're dominating their main markets.
The market is saying Microsoft is going to become a dinosaur. It's going to decline into obsolescence. This is where Klarman and I disagree with the consensus.
Look at Windows Vista; it was a horrible product. But it was still a financial success, because Microsoft had a monopoly. Then Windows 7 took over from Windows Vista and fixed it. Windows 7 was not an innovative product, but it was a good solid product.
Then, a few months ago, Microsoft showed Windows 8, which is going to come out next
year. This was the first time I looked at a Microsoft product and said “Wow!” It was created
by a company that is paranoid about competition, not something that Microsoft ever was
before. It is a very good product that is going to work not only on PCs and laptops but also
on tablets, which is very important, because tablets are the piece that Microsoft was
missing.
Apple and Google were attacking Microsoft on the tablet front, and Microsoft did not have a product. Microsoft used to sell Windows for Netbooks, which were underpowered laptops. That category of products is gone. Microsoft is going to have a very solid product with which to compete against Apple and Google next year.
What are your thoughts on the new partnership between Microsoft and Nokia?
What I really like is that Microsoft did something uncharacteristic of itself. It did not go out and buy a company, but created an alliance with a company that was extremely desperate for an alliance – Nokia. Nokia was always great at making cell phones and hardware. But when the smart phones came around, Nokia could not come up with good operating- system software.
Then Nokia’s new CEO, who came from Microsoft, struck a deal by which Nokia is going to bet its future on Microsoft software. All the smart phones that Nokia is going to make in the future will be based on Microsoft Windows. Nokia came out with its first smart phone a few months ago in Europe, and it has received great reviews.
What is important about Nokia and Microsoft together is that to be successful in this market you have to have the marriage of hardware and software. That's why the companies are working together on developing software.
Microsoft says its Nokia alliance is going to be an accelerator. It is going to allow them to bring cellphones to the market very quickly. Nokia still has a very good brand name in Europe, and it has a tremendous distribution network.
Finally, you have a new trend that the media will be making a huge deal over the next three to six month: ultrabooks. They are thin, beautiful, powerful laptops. Basically, Intel did something brilliant; it trademarked the term ultrabook. They are going to spend a couple hundred million dollars promoting the brand. If you are a PC-maker, and you want to make an ultrabook, it will have to meet very specific criteria that Intel has spelled out: It has to be light, have a solid-state drive, a fast boot time, and a long battery life.
You are already seeing these ultrabooks hitting the stores, and we are going to see a lot more of them. Right now they are expensive, but the price will come down soon. They are going to make Windows products sexy again.
Apple and Google were attacking Microsoft on the tablet front, and Microsoft did not have a product. Microsoft used to sell Windows for Netbooks, which were underpowered laptops. That category of products is gone. Microsoft is going to have a very solid product with which to compete against Apple and Google next year.
What are your thoughts on the new partnership between Microsoft and Nokia?
What I really like is that Microsoft did something uncharacteristic of itself. It did not go out and buy a company, but created an alliance with a company that was extremely desperate for an alliance – Nokia. Nokia was always great at making cell phones and hardware. But when the smart phones came around, Nokia could not come up with good operating- system software.
Then Nokia’s new CEO, who came from Microsoft, struck a deal by which Nokia is going to bet its future on Microsoft software. All the smart phones that Nokia is going to make in the future will be based on Microsoft Windows. Nokia came out with its first smart phone a few months ago in Europe, and it has received great reviews.
What is important about Nokia and Microsoft together is that to be successful in this market you have to have the marriage of hardware and software. That's why the companies are working together on developing software.
Microsoft says its Nokia alliance is going to be an accelerator. It is going to allow them to bring cellphones to the market very quickly. Nokia still has a very good brand name in Europe, and it has a tremendous distribution network.
Finally, you have a new trend that the media will be making a huge deal over the next three to six month: ultrabooks. They are thin, beautiful, powerful laptops. Basically, Intel did something brilliant; it trademarked the term ultrabook. They are going to spend a couple hundred million dollars promoting the brand. If you are a PC-maker, and you want to make an ultrabook, it will have to meet very specific criteria that Intel has spelled out: It has to be light, have a solid-state drive, a fast boot time, and a long battery life.
You are already seeing these ultrabooks hitting the stores, and we are going to see a lot more of them. Right now they are expensive, but the price will come down soon. They are going to make Windows products sexy again.
Now you have a company – Microsoft – that's actually doing smart things, and its stock
price is incredibly cheap. It has a terrific balance sheet that is still based on a monopoly,
for the most part. And you can buy it at one-third the multiple of the market. It’s a no-
brainer.
That's why Seth Klarman owns it, and we own it, too.
Subscribe to:
Posts (Atom)
Lou Manheim's Helpful Links
Lunch is for wimps
It's not a question of enough, pal. It's a zero sum game, somebody wins, somebody loses. Money itself isn't lost or made, it's simply transferred from one perception to another.