Tuesday, March 12, 2013

How 5 Top Asset Allocators Have Placed Their Bets for 2013


Tactical asset-allocation shifts are notoriously difficult to execute well year in and year out, but we've identified five managers who have proved to be skillful allocators over the long-run. In this article we take a close look at how each of our favorite allocators positioned their funds as of the end of 2012. Broadly speaking, the managers prefer equities over bonds, but how they invest within each of those asset classes differs across their funds. 

The Managers and Their Many Flavors of Tactical Shifts
All of these managers make allocation shifts in their funds, but the rationale, timing, and extent of their shifts vary. The asset-allocation committee at T. Rowe Price, headed up by Rich Whitney, has made successful tactical shifts in various funds since 1990. The team oversees the tactical positioning in the T. Rowe Price Retirement target-date funds, which have a Morningstar Analyst Rating of Gold, as well as in the firm's Silver-rated Personal Strategy and Spectrum funds. JPMorgan also has an experienced allocation group that implements tactical shifts in the firm's Silver-rated JPMorgan SmartRetirement target-date funds. Both the T. Rowe Price and JPMorgan teams rely primarily on the long-term strategic allocations of their funds, using small tactical adjustments to supplement returns.
Our list also includes GMO's Ben Inker, who has run Silver-rated  GMO Global Asset Allocation (GMWAX) since 1996, and BlackRock's Dennis Stattman, who has led Gold-rated  BlackRock Global Allocation (MDLOX) since 1989. These two managers pay particular attention to valuations at the asset class and individual security level, and they have ample freedom to differentiate their portfolios from their benchmarks. Lastly, we think highly of Rob Arnott at Research Affiliates, who has subadvised Gold-rated  PIMCO All Asset (PASDX) and Silver-rated  PIMCO All Asset All Authority (PAUDX) since 2003. (The latter makes use of leverage, while the former does not.) Arnott has no predefined benchmark allocations but instead aims to beat inflation by 5% annualized for All Asset and 6.5% annualized for All Asset All Authority over a market cycle investing across all segments of the market.
The Big Picture: Stocks vs. Bonds
For two of our favorite asset allocators, the call on stocks is a straightforward relative value decision. As of Dec. 31, 2012, both T. Rowe Price and JPMorgan have tilted their portfolios toward equities and away from bonds. T. Rowe has a slight 2% overweighting to stocks and a 2% underweighting to bonds across its allocation funds. The firm's allocation team believes stocks trade at reasonable valuations but appear more attractive than the unfavorably low yields offered by bonds. JPMorgan's allocation team has a roughly 4.5% overweighting in stocks in its target-date funds and a 4.5% underweighting to its fixed-income target weight. The team believes there is a global economic recovery that has created a favorable environment for equities.
Unlike the target-date series, BlackRock's Dennis Stattman and GMO's Ben Inker can be more flexible by holding cash or alternative strategies. Stattman positioned his fund with a slight 1.6% overweighting to stocks relative to his benchmark's 60% stake at the end of 2012. But he has a substantial underweighting in bonds, holding 24% of the fund's assets there compared with the benchmark's 40% weighting, reflecting his concerns about the bond market's low yields. The fund has a 14% cash-equivalents stake, which Stattman uses as a source of ballast and dry powder for when more attractive opportunities arise. His team also uses that stake to manage the fund's currency exposure. Similarly, Inker has an underweighting to both equities and bonds, but with a substantially more negative view on bonds. His fund's 13% stake in fixed-income is well below its benchmark allocation of 35%, while the portfolio's 60% equity stake is slightly below its benchmark's 65% weighting. Inker doesn't find today's bond yields attractive but also isn't bullish on stocks given the firm's view on equity valuations. Instead he holds a hefty 18% stake in the firm's long-short equity strategy, GMO Alpha Only (GAPOX), as a source of assets for when market conditions change.
Rob Arnott takes a decidedly different approach. His focus on current yield as a valuation metric often leads to a net equity exposure below 30% of assets. At the end of 2012, PIMCO All Asset held nearly 70% of its assets in bonds, while PIMCO All Asset All Authority maintained a 60% stake. Arnott has concerns about rising interest rates similar to the other managers, which is why most of his bond exposure comes from high-yield and emerging-markets bonds. In both funds, Arnott has reduced the Treasury Inflation-Protected Securities allocations over the past year, as he finds the securities too expensive. For All Asset, this has led to increasing the equity stake to 19% of assets from 13% at the beginning of 2012. In All Asset All Authority, the fund has a 4% net short position in stocks because of Arnott's unfavorable view on equity yields.
Not All Equities Look Great
While several of our Gold- and Silver-rated allocation managers favor stocks over bonds, they are particular about which stocks to own. Both T. Rowe Price and JPMorgan favor large-cap equities over small-caps, as they believe small-cap stock valuations are too high. In fact, the small-cap Russell 2000 Index has a price/earnings ratio that indicates that it is trading near its all-time high relative to the large-cap Russell 1000 Index, as of December 2012. Inker also leans toward large-cap stocks but goes a step further by preferring high-quality large-cap companies. These businesses have low debt levels and stable profitability that should help them perform well in challenging market environments.
Most of these managers also find foreign stocks more attractive than domestic equities. In regards to foreign developed markets, JPMorgan’s allocation team likes European stocks excluding U.K. equities for their cheap valuations relative to other developed markets. Inker at GMO also finds some developed markets attractive, as he has found relatively cheap equity valuations in Europe and Japan. Stattman also likes the valuations of Japanese equities, allocating 7% of the fund's assets there. He believes the market overly sold off Japanese stocks and that the country's recent fiscal and monetary reforms will help its economy.
Many of the managers have favorable views on emerging-markets stocks. Both JPMorgan and T. Rowe Price have long-term biases toward emerging-markets stocks over developed markets, as the firms like the growth prospects and economic fundamentals of emerging markets. Arnott also has been attracted to the higher expected growth rates of emerging markets. In both of his funds, he invests nearly all of the equity positions overseas, with roughly half that stake in emerging markets.
Not All Bonds Look Bad
Most of the managers have low expectations for bonds, particularly U.S. government-related debt, but they aren't ruling out all fixed-income securities. In general, the managers favor bonds with greater sensitivity to credit risk and lower sensitivity to interest-rate changes. T. Rowe Price has a slight 1% overweighting to high-yield bonds and a 1.5% tilt toward emerging-markets debt. The firm expects U.S. corporate default rates to remain low and believes the fiscal status of emerging-markets countries is more favorable than in developed markets. JPMorgan also leans toward high-yield bonds in its portfolios, but the firm has a neutral position in emerging-markets debt. JPMorgan's allocation team has concerns about the rapid flow of money into emerging markets over the past few years. Inker has minimal bond exposure in his fund, but most of his small allocation is in higher-yielding bonds and emerging-markets debt.
Arnott invests in similar securities to the other managers but has substantially more-pronounced allocations. In both All Asset and All Asset All Authority, he splits the fixed-income weighting roughly in half between credit-sensitive strategies, such as high-yield bonds and bank loans, and emerging-markets debt and currencies. He finds that these segments of the market continue to offer decent yields relative to other parts of the bond market, even after the yields have fallen over the past several years.
Take-Away
Making tactical allocation shifts is a tricky business, as it requires both foresight and patience. These managers have shown over long periods of time that they can add value through tactical shifts. Understanding the views of these top allocators can help set expectations for investors, even if investors aren't tactically moving their portfolios. For instance, the managers' uniformly negative stance on U.S. government-related debt suggests that investors may want to be mindful of that area of their portfolios. For the more tactically inclined investor, as several of these managers make clear, it may help to remember that cash and other liquid securities can become an attractive asset class when the market doesn't offer many clear bargains.

Friday, March 08, 2013

An Inflated View of the Dow Jones Industrial Average


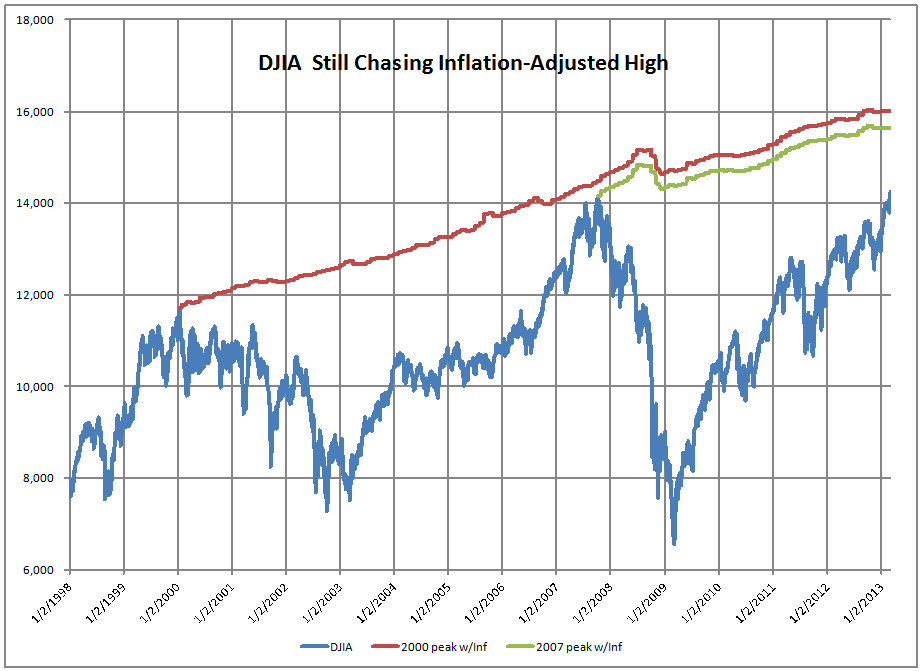
So the DJIA has hit a new nominal high?  Big deal.  It has not yet eclipsed its inflation adjusted high, as is noted by this article at Bloomberg, where they said:
None of this is to say don’t invest in stocks. Nor is it to say a bubble has formed, like the technology boom of the late 1990s and the housing-fueled run-up of the mid-2000s. The evidence may even point in the opposite direction on this score: The price-to-earnings ratio — what it costs to buy a dollar of a company’s profit — for stocks in the Standard & Poor’s 500 Index is 16 percent below the level at the end of 2009.
The same goes for the Dow, which has more than doubled in four years, yet its valuation is 15 percent below the 20-year average. When adjusted for inflation, moreover, the Dow is still 9 percent below the previous all-time high hit on Oct. 9, 2007. In other words, stocks are still a bargain, historically speaking. [Emphasis mine]
Sorry, but that’s not true, the Dow is still 12 percent below the inflation-adjusted all-time high hit on Jan. 14, 2000.  Have a look at this graph:

DJIA_15935_image001
People forget how badly the DJIA, much less the S&P or NASDAQ overshot in 2000 from tech speculation and loose monetary policy from the Fed to cover for Y2K.
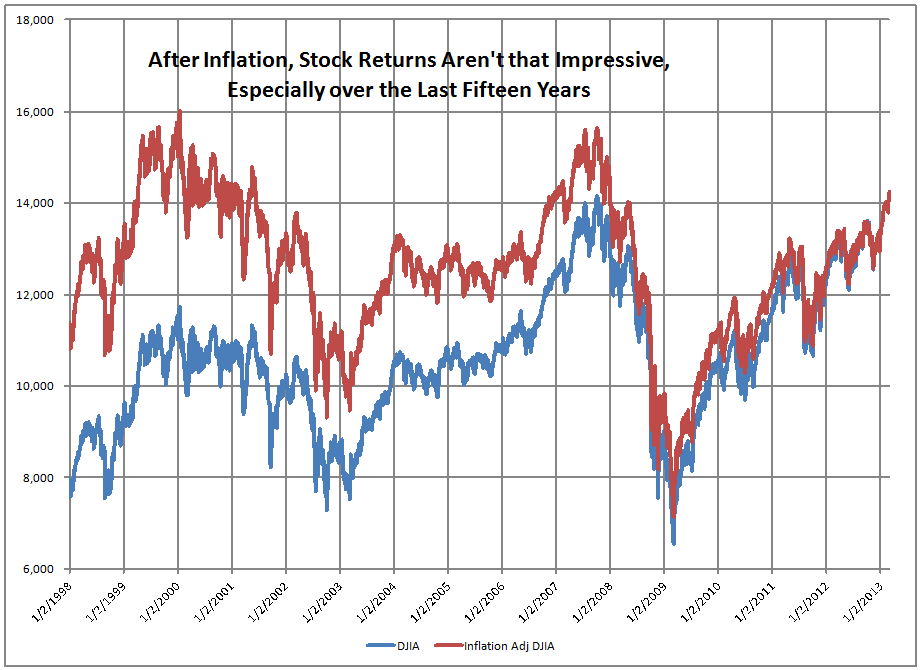
Here’s another graph to express the same idea:
DJIA_29278_image001
Yes, there may have been a ~2% dividend over the last fifteen years, so the DJIA with dividends beat inflation by a little.  Bonds did a lot better.
All I want to say is that there is little reason for excitement over new nominal highs in the DJIA.  Also, it is a weird average, and gives IBM too much weight.  There is a better way to create a megacap index as I pointed out in the prior link.
So take a chill pill, and realize that  the DJIA is a weird index, still behind inflation-adjusted highs, at a time when profit margins are at all time highs.  This is not sustainable, and long-term valuation measures like the Q-ratio and CAPE10 indicate a market 20% or so overvalued.
So to all I say take defensive measures.  Of course things can go higher, but markets were a lot lower in 2002 than in 1999.

Bridgewater Associates is the $145 billion hedge fund elite college grads are clamoring to work for. Daniel Gross on the oddball firm’s special sauce.

Raymond Dalio
Raymond Dalio, the president and founder of Bridgewater Associates. (Scott Eells/Bloomberg, via Getty )
In the Northeast, spring is in the air, and at Ivy League schools, kids are planning their postgraduate futures. But this year, many of the smart young finance things who used to flood to positions at name-brand banks in lower Manhattan are casting their sights elsewhere. It’s not a bank. It’s not in New York. And it’s not a century-old global institution with a patrician name.
It’s Bridgewater Associates. Based in Westport, Connecticut, and founded and led by a person who is equal parts investing savant and shaman, Bridgewater might best be described as an alternative alternative asset-management company. It’s the creation of Ray Dalio, who was memorably described in a great New Yorker profile by John Cassidy thusly: “He looked a bit like an aging member of a British progressive-rock group.” Big shots like Stephen Schwarzman of Blackstone and Steven Cohen of SAC Capital may garner the headlines. But in recent years Dalio and Bridgewater have ridden new investment flows and superior performance to become America’s largest hedge fund, with about $145 billion in assets.
Bridgewater, which has 1,300 employees, isn’t for ex-jocks or day traders. Rather, it tends to attract—and look for—self-styled intellectuals and deep thinkers who like constructing arguments as much as they enjoy constructing portfolios. It’s “the thinking Yalie’s destination,” as one recent Yale graduate put it. Undergrads at Harvard report that the scandal-free firm is more desirable than Goldman Sachs, previously the ne plus ultra for young grads on the make. “Bridgewater is very popular because it is one of the few hedge funds that will accept people right out of college,” says a Harvard undergraduate who interviewed with the firm. “Also, the hours tend to be better. In investment banking you’re working 100 hours a week, and at hedge funds it is more like 70.” (This student may be overestimating the amount of time employees of both investment banks and hedge funds spend working).
Economist Joseph Schumpeter, who invented the phrase “creative destruction,” analogized the upper strata of society as a hotel in which the guests are always checking in and out. That has been the case on Wall Street for the last many years. The list of blue-chip recruiters in 2006 would have included Lehman Brothers (bankrupt), Bear Stearns (essentially failed and merged into JPMorgan Chase), and Merrill Lynch (now a unit of Bank of America). The survivors—Goldman Sachs, JPMorgan Chase—are all shedding workers and bringing in smaller classes. Meanwhile, other companies have come up in the world. BlackRock, the bond giant, boasts more than $1 trillion in assets. Private-equity firms like the Blackstone Group and KKR, which weathered the storm, are continuing to transform from small partnerships into large institutions. They’re hiring.
Then there’s Bridgewater, whose workplace more closely resembles The Master than Wall Street; the trading day is like a long encounter session in which people learn about themselves, and then trade their way to prosperity.
The edge at most hedge funds is getting an informational edge, or using holdings to push for changes in management. Bridgewater, which manages money on behalf of public-employee pension funds like the Pennsylvania Public School Employees’ Retirement System, foreign sovereign wealth funds, and other institutions, has a different approach. Bridgewater is a macroinvestor, meaning it analyzes big-picture economic trends, data, and market behavior to come up with ideas about how to profit off the movement of stocks, bonds, and currencies all over the world. The strategy appears to be working: Bridgewater’s main fund has returned 14 percent annually since 1991, with only one losing year—an astonishing record. As The Economist noted, over the last several years, the hedge-fund industry at large has underperformed the S&P 500 index.
To keep its machine finely tuned, Bridgewater searches out young intellectuals in addition to hiring experienced workers. No surprise they recruit from the Ivy League. The company “recruited incredibly aggressively at Yale,” noted one recent Yale graduate. “They offered students who did not apply for their summer internship program $100 gift cards to sit in a focus group and explain why.” Students say they received several emails from the company—personally addressed to them from friends or associates who were at Bridgewater.
The interviews themselves have become legendary. “Really weird” and “very confrontational” were two phrases used by students to describe the on-campus interview. A candidate is likely to be put in a room with about seven people. Instead of being grilled about stock trades or economic issues, students will be asked to debate controversial topics like Roe v. Wade or gun control for an hour. “They wanted you to compete with each other,” said a Harvard undergraduate. “Unsurprisingly, quite a few members of the Yale debate team end up working there,” says the recent Yale graduate.
A Bridgewater spokesman said the company doesn’t disclose how many campuses it visits. “Hiring from college and M.B.A. programs has always been an important part of our hiring,” he said. As for numbers, there’s no typical minimum class size. “There is no quota. We will hire people we think are very talented and will be great contributors and a fit with our company.”
The company marches to a different drummer. When I approached Dalio, a jazz aficionado, at this year’s World Economic Forum in Davos, Switzerland, and asked to speak with him, I said: “I know you don’t do a lot of interviews because—” He completed the sentence: “Because we’re weird?” (I was actually going to say because Bridgewater is privately held and isn’t engaged in the constant grind of fundraising—but yes, Bridgewater does have a reputation for being weird.) I didn’t get the interview.
Dalio doles out life advice and investment returns in equal measure. He runs the firm according to the doctrine of what he calls “radical transparency.” Employees are consistently challenged to defend their views. Personal criticism of colleagues is encouraged, even compulsory. Meetings are taped. Dalio has laid out his principles of management in a 123-page, 210-point manifesto. To succeed at Bridgewater, you have to buy into the system. And it’s clearly not for everyone. Check out the lengthy comment thread about Bridgewater at the jobs site One Day One Job. Among the posts from anonymous former workers: “Once you accept the offer and go through the “orientation” process you will be judged and criticized nonstop. I only made it there for 4 months before my wife convinced me that money isn’t worth it.”
Bridgewater also sets itself apart geographically. It’s not in New York. It’s not even in Stamford, the satellite financial-service area, which allows for easy commutes from the city. Rather, it’s in Westport, a more distant, but lovely, suburb (I live there), filled with 40-something and 50-something professionals, rather than 20-something finance newbies. The company’s headquarters are tucked in a wooded area in the northern part of town. Unless you knew it was there, you wouldn’t know it was there. Many of the young hires share rental apartments in the area during the week and live in Manhattan. The company runs buses back and forth from New York every day.
Bridgewater has added high-profile executives in recent years, including former assistant attorney general James Comey and David McCormick, a former George W. Bush Treasury aide. The company last year announced it is considering plans to build a lavish new headquarters in Stamford.
But it’s not simply the location or even the money that makes Bridgewater trendy. This is a distinction that may not seem like much to outsiders, but Bridgewater isn’t really part of the crisis-era financial system. Bridgewater wasn’t involved in the bailouts, took no Troubled Asset Relief Program money, didn’t securitize mortgages, doesn’t borrow from the Fed, and hasn’t been implicated in any insider-trading scandals.
Ivy League kids still want to make money and are still drawn to the financial-services industry. Last December I guest-taught in a session of an undergraduate course on finance and economics at Yale, and virtually all the students in the class expressed an interest in working in finance. But they didn’t want to be seen as embracing the negative aspects of finance.
For years, Goldman had the greatest cachet and mystique among this crowd. No longer. If you’re 22, notes Kevin Roose, “all your friends are skeptical of the banking industry.”
“If you tell someone you do finance, they’ll say ‘You sold your soul,’” says a Harvard undergraduate. “There’s been a big surge in interest in startups, computer science, and entrepreneurship. They call it the Zuckerberg effect.”
With its intensely intellectual work climate, flat hierarchy, and lack of attachments to the tainted sectors of the financial complex, Bridgewater offers bright young things a way to work on Wall Street without really being part of it. Which is nice work if you can get it.

Gold Miners In Crash Mode

Regular readers of the blog know that I usually do not discuss Gold Miners specifics when it comes to the Precious Metals sector. I usually place a lot more focus on Gold and especially Silver, which happens to be my favourite investment for the coming years. However, looking at the recent Gold Miners price action and crash-like conditions, I cannot hide my excitement as we see extremely oversold levels and extremely pessimistic sentiment.
Let me share a few charts and indicators I am looking at right now, which signal that we are either close to a bottom or most likely already there:
Chart 1: Gold Miners are most oversold since 2008
Source: Simone Alberizzi
Looking at the weekly chart of the Gold Miners, we can make two conclusions. The first, the uptrend started in late 2000 and the second, we are currently at the most oversold level since late 2008 and late 2000 - both being major buying opportunities in the current secular bull market. While the price could make further lows in the short term, I assume that a reader looking back on this post in 12 months time would appreciate the fact that a major low was at hand.

Chart 2: Internals suggest final stage of bear market
Source: SentimenTrader / Short Side of Long

They say a bear market develops in three stages. The famous Dow Newsletter author, Richard Russell once wrote about it:
1. The first phase is the one where the bear market wipes out the optimism and excitement which existed at the preceding bull market’s top.
2. The second phase of a bear market is usually the longest phase. This is the phase where it gradually dawns on stock holders that business is deteriorating and that we are moving into hard times. 
3. The third phase of a bear market is the “throw ‘em in” phase where stocks are sold for no other reason than that the sellers need to raise cash.
The third stage is also the one which shows internal breadth readings hitting rock bottom capitulation levels. The common indicators that I use to track oversold levels are usually the percentage of stocks above the 200 MA and the Summation Index. Both of these show readings relative to where previous major lows have occurred.

Chart 3: Bullish Percent Index is at record oversold levels
Source: Objective Trader

Staying with the theme of internal breadth readings, another indicator is also currently proving to us that we are in the final capitulation phase of the bear market - the Bullish Percent Index. According to StockCharts.com "the Bullish Percent Index (BPI) is a breadth indicator based on the number of stocks on Point & Figure buy signals within an index. Because a stock is either on a P&F buy or sell signal, there is no ambiguity when it comes to P&F charts. This makes BPI a straightforward indicator with clearly defined signals." The chart above, thanks to the Objective Trader website, shows that we are currently at record low readings. In other words, not even the panic of 2008 pushed the Gold Mining sector to such depressive depths.

Chart 4: Valuations show Gold Miners at bargain prices
Source: BMO Capital Markets

While we can use a variety of valuations metrics, I'd hate to fall into the value trap like so many traders recently did with Apple. Apparently the stock was extremely cheap at the $650 to $700 price range, trading at ridiculously low forward P/E ratios. Well it seems that the bubble is deflating and the stock just got even cheaper.

I do not believe that the Precious Metals sector has yet to reach an euphoric frenzy such as Apple just went through (it might one day soon), so therefore tracking its Price to Cash Flow ratio could hold some value for us. According to BMO research, valuations have now reached levels similar to that of late 2000, just as the bull market was starting. This could mean two things, either the Gold Miners are currently discounting eventual Gold price decline at which point the P/CF ratio could actually rise or truly the sector has hit rock bottom bargain value.

I understand certain traders will disagree with my subjective and bullish views here and therefore they will dismiss the valuations. The market is always comprised of bulls and bears, therefore any opposing views are always welcomed at this blog.
Chart 5: Miners are very cheap on relative basis too...
Source: BarChart.com / Short Side of Long
While the S&P 500 continues to storm ahead towards its 52 new week highs with an abundance of retail hot money chasing the prices, Gold Miners have been sold off towards 52 week new lows as of this week. Out of all the major and minor sectors with the famous S&P index, the Gold Mining sector is the only one that is oversold... and extremely oversold at that.

Chart 6: ... and could outperform in coming quarters!
Source: Simone Alberizzi

The fact is, since August 2011, the S&P 500 has been on a super sprint while from a relative perspective, Gold Miners have been all but forgotten. Technically speaking, a mean reversion is now overdue. My opinion is that Gold Miners could surprise to the upside in the coming quarters ahead, at least on relative basis (chart above).

Chart 7: Gold vs Gold Miners ratio is giving us a buy signal

Source: Short Side of Long

Gold Miners have now been under performing the yellow metal since the early parts of 2011. Theoretically, the overall Precious Metal bear market started around that time and Gold Miners served as an early indicator. Mining Juniors were the first shoe that dropped and it was followed by the huge Silver crash in May 2011. This was followed by a further sell of in Gold and Silver in September 2011 (which I happily shorted back then link 1 & link 2). The whole of 2012, we spent watching PMs move in a sideways range while Gold Miners tanked. However, looking at the chart above, the ratio between Gold (the underlying asset) and Gold Miners has now reached levels surpassing the late 2008 bottom. In my opinion, this is definitely a buying opportunity.

Chart 8: Losses are approaching historical extremes
Source: Short Side of Long

Finally, the annual performance of the Gold Mining sector has been in the slumps for most of 2012. The price itself has gone through two mini crashes which easily rival the infamous 2008 panic. The last two major buying opportunities that reached 1.5 SDs on the downside happened in 2000 and late 2008. While we aren't there yet, we are definitely fast approaching similarities to those two extremes. Therefore, while further downside might exist in the short term (as already explained above), it is important for an investor to gauge his longer term bearings towards the bullish side.

The Bottom Line
As we judge the recent cyclical bear market within the longer term secular uptrend, we can see that Gold Miners are becoming very attractive. Whether it is the technically oversold levels that only occur a handful of times over a generation, the rock bottom valuations on nominal or relative basis, or the extreme sentiment that the overall sector is going through, all of these indicators point to one conclusion: we are fast approaching a major buying opportunity. Time to put your dry powder to work!

Tuesday, February 19, 2013

Value Stocks Are Hot—But Most Investors Will Burn Out

"Most people aren't cut out for value investing, because human nature shrinks from pain," the money manager Jean-Marie Eveillard told me this past week. His words are a reminder that making money on cheap stocks—the goal of every value investor—is harder than it sounds and can take years to play out.
Lately, value investing has seemed easy. Over the past year, the Russell 1000 Value Index, a yardstick of cheap stocks with sluggish expected earnings, is up 19%, compared with 11% for pricier "growth" stocks and 15% for the full Russell 1000 index of big U.S. stocks. The public has started to notice: Mutual funds specializing in large value stocks took in $2.4 billion in January.
But as Mr. Eveillard warns, the long-term rewards don't go to people who think value investing is easy. Superior returns can be earned only by those who know that it is hard—and stay put.
Take it from Mr. Eveillard. From 1979 through 2004, he was the lead manager of the SoGen International Fund (now First Eagle Global ). Over that period, the fund earned an average of 15.8% annually, versus 11.3% for the MSCI World Index of global stocks—one of the widest and longest margins of outperformance on record.
But in the late 1990s, "new economy" stocks—think Internet startups—were hot. Mr. Eveillard owned the old economy: railway, gold-mining and Japanese insurance companies. His fund trailed the index by 25 percentage points in 1998.
"After one bad year investors were upset," he recalls. "After two they were mad, and after three they were gone." Between 1997 and early 2000, investors yanked out two-thirds of the fund's assets—and then missed out on its later years of superb performance.
The fund industry has long marketed the chimera of "consistency," the idea that a great stock picker can always earn higher returns than the market. Investors who buy into this myth often sell in a panic as soon as the next crash proves that no stock picker can always outperform.
Over the decade ended Dec. 31, value funds specializing in large stocks returned an average of 6.7% annually. But the typical investor in those funds earned just 5.5% annually, according to Russel Kinnel, director of fund research at Morningstar .
That is partly because many investors bailed out after these funds lost an average of nearly 37% in 2008; the subsequent rebound was captured only by those who stuck around. "Too many investors tend to think that [value] strategies are flawless or 'bearproof,'" Mr. Kinnel says—and then sell out in shock when they realize the strategies aren't.
Summit Street Capital Management, an investment partnership in New York, recently analyzed a group of value investors with long records of superior returns and found that even the best underperformed one-third to 40% of the time. "It's hard not to get shaken out unless you understand that and have conviction," says Summit Street partner Jennifer Wallace.
You also should understand how the present and future might differ from the past. Since 1926, value stocks have outperformed growth stocks by an average of four percentage points annually, according to the authoritative index compiled by finance professors Eugene Fama of the University of Chicago and Kenneth French of Dartmouth College.
But be warned: Today's typical value fund might not be able to deliver the superior returns generated by bargain stocks in earlier decades.
Nowadays, most value managers search for stocks that are cheap relative to current or expected earnings. The bargain stocks in the best-known Fama-French index were selected on a different measure: book value, a basic yardstick of corporate net worth.
Many stock pickers don't pay much attention to book value anymore. And while small-company returns accounted for much of the historical high returns on the Fama-French index, most managers today favor larger companies.
Value stocks also are less of a bargain than they used to be. Historically, they averaged 54% cheaper than growth stocks, as measured by prices relative to earnings, says Eric Weigel, director of research at the Leuthold Group, an investment firm in Minneapolis. Today, value is 40% cheaper.
So value might fade again before long. To be a value investor, it isn't enough to buy cheap stocks or the funds that own them. You have to stick around until the market recognizes their worth. Mr. Eveillard, now 73 years old and an adviser to his old fund, is still finding bargains in Japan and among gold-mining stocks—but he is prepared to "suffer" until the market proves him right.

Buffett’s Favorite Valuation Metric Surges Over the 100% Level

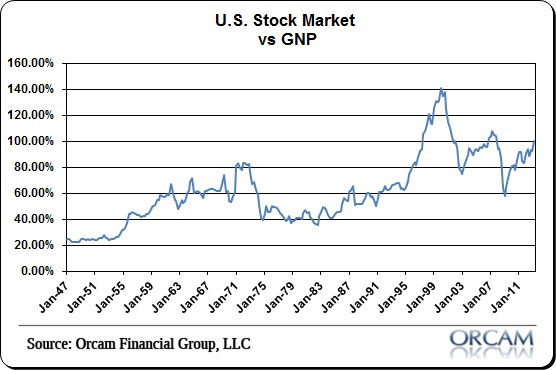
For the first time since the recovery began, Warren Buffett’s favorite valuation metric has breached the 100% level.  That, of course, is the Wilshire 5,000 total market cap index relative to GNP.  See the chart below for historical reference.

I only point this out because it’s a rather unusual occurrence and the recent move has been fairly sizable.  It happened during the stock market bubble of the late 90′s, but then occurred again just briefly during the 2006-2007 period when the valuation broke the 100% range in Q3 2006 and stayed above that range for about a year.  We all know what followed the 2007 peak in stock prices.

Here we are in this wonderful new world where everyone values nominal stock prices more than they value the actual output that underlies it.  If this indicator isn’t a sign that we are still residing in this Fed driven asset targeting mania then I don’t know what is.

To me, the whole thinking is backwards and more disruptive than anything else, but the party must go on.  Lord knows the Fed isn’t taking the punch bowl away any time soon.  So drink up.  Maybe you’ll get so drunk you’ll sleep through the inevitable bad parts when they arrive.

Chart via Orcam Investment Research:
buffett Buffetts Favorite Valuation Metric Surges Over the 100% Level

Housing Market vs. S&P 500 Financials, w/ 2 Yr. Lag (Chart)

fin

Performance of Morningstar's New Analyst Ratings For Mutual Funds in 2012

Last year I wrote about Morningstar's new analyst ratings for mutual funds (here as well). These are different from their Star Ratings in the fact that these are meant to be "forward looking". From Morningstar (bold added by me)
"The Analyst Rating is based on the analyst's conviction in the fund's ability to outperform its peer group and/or relevant benchmark on a risk-adjusted basis over the long term. If a fund receives a positive rating of Gold, Silver, or Bronze, it means Morningstar analysts think highly of the fund and expect it to outperform over a full market cycle of at least five years."
Now it should be clear that these ratings are longer-term in nature so take the following breakdown with a grain of salt but I said I would follow-up on these so I am.

First lets start with a review of what the distribution of Morningstar's Analyst Ratings looked like at the start of 2012
While the distribution of ratings has gotten a little better it remains a mystery why Morningstar has an allergic reaction to assigning negative ratings. As of the start of 2013 they have now rated 1069 funds but only 52 (or less then 5%) have negative ratings. Although the neutral ratings have increased to 28%, Bronze to 25%, Silver is down to 24% and Gold down to about 18%.

Without further ado, below is how the rated funds performed in 2012. These only include funds rated at the start of 2012.
Not much really stands out after the first year. While their was a slight positive result for Gold and Silver rated funds, Neutral rated funds did even better. As for Bronze and Negative rated funds, outperformance was pretty much a coin flip.

Below is the Average Rank for each, as you can see Neutral rated funds performed the best and Negatively rated funds performed the worst.
Take this for what it's worth, which at this point is not much because full market cycles are indeed a better measuring stick. For instance, in 1999 and 2006/2007 a lot of bad managers did good thinking the unsustainable was in fact sustainable while a lot of good managers did bad as they realized irrationality when they saw it. However, this is at least a starting point for looking at the performance of these Analyst Ratings.

Smaller Hedge Fund Managers Outperform: A Study of Nearly 3,000 Equity Long/Short Hedge Funds

One of the most vexing issues in the hedge fund industry is the relationship between growth in assets under management (AUMs) and future returns. An abundance of anecdotal evidence suggests that smaller managers with great performance attract capital quickly, which dilutes future returns. Further, the recent concentration of capital among large hedge funds has raised questions as to whether this has contributed to the decline in industry-wide alpha.
In a recent report, we analyzed nearly 3,000 equity long/short funds in order to get to the heart of this issue. Prior studies have had limited usefulness due to three issues:  (a) the inclusion of backfilled database returns, which seriously distorts the overall results (Pertrac and Barclays); (b) a population of funds across the industry as a whole which includes differing strategies with divergent capacity issues; and (c) a failure to exclude managers or funds below a reasonable AUM threshold (most studies), which results in an impractically small average fund size. By contrast, we focused narrowly on the equity long/short space since these managers are likely to face similar capacity constraints (as opposed to, for instance, macro investors or CTAs). Backfill issues were addressed by including fund returns only from the date when the funds began to report to the database; our studies show that “pre-reporting” returns are 6-8% above “post-reporting” results, which shows the magnitude of the issue. Finally, we grouped funds according to manager since many funds have multiple share classes and since some growth-related issues are firm-specific as much as they are fund-specific.
In our study, we divided the universe into firms that managed $50 million to $500 million in equity long/short AUMs (“Small”) and those that managed more (“Big”). The $50 million lower bound was selected to make the sample more representative of an actual emerging manager investment program. The result of the study clearly demonstrates that smaller hedge fund managers tend to outperform larger ones – a conclusion that will resonate with many hedge fund investors:
  • Small firms outperformed Big by 254 bps and 220 bps per annum over five and ten years, respectively;
  • Outperformance was most pronounced preceding and following the crisis, especially 2009, while drawdowns were in line during the crisis;
  • Virtually all of the outperformance was due to alpha, not beta; and
  • The dispersion of returns among smaller funds was greater than those of larger firms.

The fund population in the Beachhead study consisted of 2,827 equity long/short hedge funds drawn from the HFR database of live and dead funds. Funds were included based on strategy classifications for fundamental value, fundamental growth and sector specialists in technology, healthcare, energy and basic materials; quantitative-driven, market neutral and short biased funds were excluded.  For each year, the funds were grouped into Small and Big portfolios that were equally weighted and rebalanced monthly. To mitigate backfill bias, the returns for a given fund were only included as of the date it began reporting to the database.
In the sample, the number of Small and Big firms was roughly equal. In 2012, a Small firm managed $193 million on average while a Big firm managed $3.7 billion.  Interestingly, average Big firm assets have tripled over the past decade while Small firm assets have remained roughly constant, which reinforces the view that Big firms have had a much easier time attracting capital.
Over the past ten years, Small equity long/short managers returned 7.56% per annum and outperformed their larger peers by 220 bps per annum (over the past five years, outperformance was 254 bps per annum). Small managers showed a moderately higher annualized standard deviation, but drawdowns were in line and the Sharpe ratio was significantly higher. The chart below shows the returns of Small and Big managers over the past ten years.

As shown below, Small managers materially outperformed both before and after the crisis, especially during the post-crisis recovery. Somewhat surprisingly, despite somewhat higher beta, smaller firms did not underperform larger ones during the crisis, which may reflect superior risk management or a more manageable capital base.

The remarkable consistency of the outperformance is evident in the following chart. The date on the top row reflects the inception of an investment that terminates in the year on the vertical column; the percentage in the corresponding cell reflects the compound annual return differential of Small less Big over the specified period. For instance, the cell on the upper left shows 2.20% of compound annual outperformance of Small vs. Big over 2003 to 2012. Green boxes show periods of outperformance of Small.

It’s notable that outperformance does not appear to be attributable to rapid or regular changes in market exposure; rather, the beta of Small to Big is quite consistently around 1.1 with stable correlations above 0.95. Consequently, comparable drawdowns during the crisis itself seem to reflect somewhat larger market-driven losses offset by persistent positive alpha.
The following chart examines the alpha of the Small portfolio relative to the Big portfolio over the ten year period.  Note that alpha is annualized in the box. The vast majority of outperformance is due to alpha, not beta, which confirms that higher risk taking does not explain the differential.

We also studied the dispersion of returns in order to test the hypothesis that smaller managers are motivated to outperform, while larger firms are likely to be more risk averse. The chart below shows the annual returns of the funds in the Small and Big portfolios with the mean, minimum and maximum fund returns. In virtually every year since the late 1990s, the top performing Small funds have materially outperformed the comparable Big funds.  Interestingly, the worst performing Small funds matched or outperformed the comparable Big funds in the vast majority of years, which supports the argument that Small fund outperformance is not driven by higher symmetric risk taking.

As a final test, we analyzed what would happen if the “threshold” between Small and Big managers was lowered or raised. The chart below shows the differential in returns over the past five and ten years and clearly shows that outperformance of “smaller” managers declines as AUMs increase. For instance, when “small” is defined as less than $1.0 billion, the outperformance relative to larger managers is 1.1% over ten years and 0.6% over five years.

The key question for investors is what factors drive the differential in returns. Three potential factors include:
  • The most talented managers self-select to start firms rather than work at larger firms. Many talented managers build experience in larger firms before launching their own firms.
  • Smaller managers have a better opportunity set:  based on trading volume, the number of potential long and short side investments declines by up to 80% between $100 million and $1 billion in AUMs. Off the run and less efficiently priced stocks can have a meaningful impact on returns. Anecdotally, capacity issues materialize sooner on short positions.
  • Pressure to perform:  performance fees are a higher percentage of overall compensation and drive asset growth. Our analysis suggests that up to 80% of the enterprise value of larger firms is due to capitalized management fee EBITDA as opposed to performance fees.
The study is part of a series of papers on the equity long/short space and is available at www.beachheadcapital.com.

Monday, February 11, 2013

Notes From Bruce Berkowitz's CSIMA Talk


- On diversification: it dumbs us down because we can't focus on a few things that can make a difference.  You're most likely not the only fund your investors are in so you have to be more risk averse for your own job safety.  Most managers hold too many positions.  Less than 10 positions typically equals career risk.  The benefits of diversification fall off between 10-30 stocks in a given portfolio.  If investors put around 10% in one fund and that fund holds 10 stocks, they effectively hold 100 stocks.

- On spending time with clients: it's actually a disservice to them to spend time away from investment research.  You need to be focused on your investment process as it will benefit them more than spending time with them.

- On time management:  the best way to maximize your time is to say "no" to a lot of people.  He likes to get the most out of every minute so he's even listening to books on tapes.

- On investing: If you hustle on the investment trail and do it 24/7 you'll be a great investor 30 years from now.  Take 2 steps back to take 10 steps forward, sometimes it's necessary. He reads company reports before going to bed and is always listening to conference calls.  He also emphasized decoupling from the herd or the groupthink of Wall Street (most likely why he's in Miami instead of New York).  To do well in life, you've got to be excited. 

- On Sears (SHLD): He still likes the stock and the real estate is what's attractive to him.  It has more commercial square feet than Simon Property Group (SPG), but SPG is worth 10x more than Sears (using enterprise value).  Some investors argue that Eddie Lampert isn't a retailer, but look at AutoNation  (AN), which he's also been involved in.  Berkowitz feels that he has a nice margin of safety at the prices he bought at and has the potential to make a lot of money.  (We've previously posted Berkowitz's case study on Sears.)

- On Bank of America (BAC): A lot of people are fixated on the Countrywide problems, but great earnings are there and in the future that Countrywide drain won't be there so the earnings power is just starting to show.  (We've also posted Berkowitz's Bank of America case study.)

- On American International Group (AIG): The company will eventually become a profitable insurance business as they're the price leader.

Great Rotation hovers on the horizon (Hasenstab + Arnott)


When will there be a change in the wind? For four years it has blown investors in one direction: out of stocks and into the relative safety of bond funds.
But while there are plenty of warnings that bondholders face losses from rising interest rates, rallying stock markets have yet to be propelled by a real gust of enthusiasm.
Flurries of interest in the new year, though, have brought rising interest in the idea of a ‘Great Rotation’: the idea that money will flow out of bonds and back into stocks.
US stock funds attracted $21bn in the first four weeks of the year, according to Lipper, the largest inflow for any four-week period since the peak of the dot-com boom in April 2000.
Meanwhile equity funds globally took in assets at three times the pace of bond funds, according to EPFR. The research group also found that equity flows from retail investors, who tend to be slow to react to turning points in markets, are on track for the strongest start to the year since 2006.
The inflows come as some influential bond investors have already positioned themselves to avoid interest rate risk.
“There’s probably a growing understanding that interest rates have to go higher at some point,” says Michael Hasenstab, who oversees $175bn in fixed income for Franklin Templeton. “We’ve actually taken that conviction and put it in place.”
At the same time there are signs of investor optimism. UBS says its long-only and hedge fund clients were net buyers of equities in crisis-hit eurozone “periphery” countries in eight of the last 11 weeks, with average flows at the highest level in more than two years. Unloved Spanish equities have seen buying for four weeks in a row.
But Nick Nelson, UBS global equity strategist, argues for context. “It is not a rotation, it is a mini-rotation. It doesn’t look to us that it’s euphoria or super extended,” he says.
And Romain Boscher, head of equities at Amundi, says that in Europe it is not as simple as money flowing from fixed income straight to equities. “This is not new money moving in favour of equities. We’re just seeing money that left Europe coming back again.”
Indeed, the term is in one sense a misnomer. “Every stock certificate and bond certificate must be owned by someone at every point in time,” says John Hussman of Hussman Funds.
Rather it reflects the sentiment at the margin, where new savings are directed, and increased demand for stocks is still tentative and cautious.
“We’re still in a world where if there’s a shock to equities, bonds will do well. So bonds still play an important role as a diversifier. In five years’ time, who knows, but stocks and bonds stapled together are a very interesting investment in the near term,” says André Perold, chief investment officer for HighVista Strategies, an investment firm for endowments.
Patrik Schowitz, global strategist for JPMorgan Asset Management, says he is overweighting stocks relative to bonds, but largely because the latter are so expensive.
“It would certainly help if we had a rip-roaring economic environment,” he says.
Robert Arnott, who runs two asset allocation funds for Pimco, sees recent moves in the stock and bond markets as opportunities to be tactical, selling what has rallied and buying what has fallen.
He also says the source of January inflows may simply be the flurry of bonuses and special dividends paid out in the US ahead of this year’s tax rises. He describes this as “a flood of demand from income that would have normally occurred in January, February and March that needs a home”.
Even were there a greater sense of optimism though, there is much built-in inertia at big investors such as pension funds and insurers.
Solvency regulations in Europe encourage insurers to hold bonds, while accounting rules have pushed US pension funds in the same direction.
“A good two-thirds of corporate pensions have put derisking plans in place,” says senior Mercer consultant Richard McEvoy.
That will continue a trend which the consultancy calculates has caused pension funds of S&P 1500 companies to cut equities from 65 per cent of assets to 50 per cent over the past decade, while bond allocations have risen 10 percentage points to 39 per cent.
So the investment weather remains mixed. Looking back over his 44-year investment career, Charles Brandes, chairman of Brandes Investment Partners, says the current period most reminds him of 1980.
In 1974 the US market dropped 47 per cent. It rallied in the following two years, but by 1980 interest rates were rising to combat inflation and the economic outlook remained uncertain. “It wasn’t until 1982 that we saw the start of the big bull market, and maybe we are two or three years away from that,” says Mr Brandes.

the hockey stick


Yesterday, Alhambra Investment Partners posted a revealing set of charts about earnings growth (or lack thereof).  So much focus is given to whether company reports beat estimates, but estimates don’t mean much if they have dropped like rocks in the months leading up to the reports.
That’s what we’ve seen of late — and the actual results have been lackluster to say the least.  But never fear, estimates for this year show remarkable growth is on the way:

Could that happen?  Sure.  But you might want to bet against it, since this is the way it pretty much always looks at this time of year, before the relentless decline in estimates begins.
If you are using sell-side forecasts, there are things you can rely on.  (Yesterday’s chart on research puzzle pix highlighted three of them.)  Another is that a hockey stick is almost assuredly baked in the cake.  Pull it out.

Monday, February 04, 2013

Is the Secular Bear Market Coming to an End?

 
A decade ago, I concluded that we were in the early stages of a secular bear market, and that investors needed to adjust their risk postures accordingly. Back in December 2003, I penned a piece for the Stock Trader’s Almanac, titled Managing the Very, Very Long Term, based on this blog post from November 2003.
Long time readers know this is a major theme to for me. Much of my commentary, presentations and investing posture has been about longer term, secular cycles. Search the Big Picture for the phrase “secular bear market” and 659 results come up (in quotes, 130).
Here’s what I wrote back in 2003:
“The panoramic view leads me to the present conclusion. Following an 18-year Bull market [1982-2000], and a three year Bear market, we are now committed to what looks like a long-term military obligation in Iraq. In the grand scheme of things, I suspect we are in for a harder long-term slog than the mere 3 year Bear market suggests.
Historically, this suggests an extended period of range bound trading as the highest probability long-term scenario in my view. I expect vicious rallies, and wicked sell-offs to occur — over shorter term cycles — within the larger timeline. Active management and capital preservation are going to be the key methods of outperformance.”
Let’s put this into more specific quantitative terms. According to data from Fidelity:
• Average secular bull market lasted 21.2 years and produced a total return of 17.2% in nominal terms and 15.9% in real terms. The market’s P/E more or less doubled, from 10.1 at the start to 20.5 at the end.
• Average secular bear market lasted 14.5 years and had a nominal total return of +1.0% and a real return of –2.3%. The market’s P/E compressed by an average of 9 points, from 20.5 at the start to 11.3 at the end.
Here we are, a few weeks away from the start of the 14th year of the secular Bear market that began March 2000. The question on more than a few peoples’ minds has been whether or not it is reaching its end.
To answer that question, we need to understand exactly what a secular bear market is. Over the years, I have developed a my own definition of Secular Bear Markets:
“A of Secular Bear Markets is a long term cycle which typically begins after a long term bull market peak and crash. It is primarily characterized by strong, even excessive rallies and selloffs, all occurring within a broad trading range. Despite the strong rallies, markets often appear to be unchanged a decade or so into secular bears.
The psychology is one of compressing Price to Earnings multiples, as investors become increasingly unwilling to pay the same price for each dollar of earnings. There is often a general malaise to the broader society, sometimes encompassing political scandals and/or war.
On Main Street, there is a general disinterest in equities. Ratings for financial television and other media fall. Interest in non stock investments — especially Bonds, Commodities and Real Estate — rise.”
To conclude that the Secular Bear is ongoing, we need to see a few factors:
-Are markets still rangebound? Have we made new highs in various indices?
-Are P/E multiples still contracting?
-Are financial news media ratings still falling?
-Is society generally pessimistic?
-Is Main Street still disinterested in equities?
Some of the answers to these questions are purely quantitative, and do not require any human judgment. A few of these do require a squishier answer. After 36 months or so of capital outflows from equity funds, we should not rush to judgement after the first month of inflows.
And there is a major caveat to this: The Fed’s extraordinary ZIRP/QE intervention creates an impression of inorganic gains. Without the unprecedented FOMC actions, I am unsure markets would be anywhere near current levels.
Regardless of your answer to our broad question, there is one thing that I believe to be clear: We are much closer to the end of this secular cycle than to the beginning. Many optimists — most notably, famed technician Ralph Acampora — believe the secular bear market has ended. Even skeptics have to agree that we are more likely in the 7th or 8th inning than earlier stages of the game.  Only the “America is Japan” crowd thinks we are in the 3rd or 4th inning.
The key question for investors: Are you prepared to make changes to your portfolios?

Secular Cycles

Source: Haver, Factset, Robert Shiller, FMRCo. Monthly Data, since 1871

Paul Singer Gives gold an "A" and Bernanke a "D"

http://www.hedgefundintelligence.com/Article/3147894/AbsoluteReturn-News/Paul-Singer-gives-gold-an-A-Bernanke-a-D.html

Monday, January 28, 2013

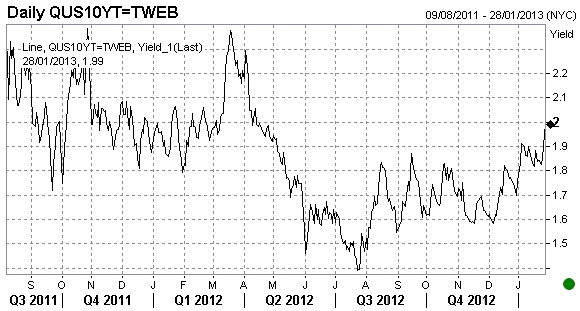
First time in a while: 10 year Treasuries pierce 2 per cent


In case you missed the moment earlier on Monday, here’s the yield on US 10 year paper breaking through 2 per cent – albeit momentarily. At pixel the reading stood at 1.99…
Courtesy of Tradeweb


We haven’t seen that since April last year…


Thank durable goods orders coming in better than expected in December in the US.
In explaining the move, newswires were also citing a statement from Fitch saying the chances of the rating agency stripping the US of its triple-A status in the near term had receded following the temporary suspension of the debt limit.

Yes, can-kicking is now “bad” news as far as safe havens go.

The point of low return


Antti Ilmanen, a quant from the AQR group (and author of the excellent book Expected Returns), makes the point succinctly in the attached graph. What does the line show? Mr Ilmanen's definition is that
The "60/40 expected real return" is the forward-looking long-run real return of a 60/40 U.S. stock/bond portfolio. Stocks' forward-looking real return is proxied by an average of two measures: (i) smoothed earnings yield, or the inverse of the Shiller P/E and (II) the sum of dividend yield and 1.5% (a proxy for long-run growth rate in earnings per share). Bonds' real yield is the difference of the 10-year Treasury yield and a measure of expected inflation over the next decade. Inflation expectations are proxied by an average of several survey forecasts; before these became available in 1978, statistical estimates are used.
As you can see, the outlook for expected returns is as low as it has been in more than a century, with real US returns likely to be 2.3% a year. Overaggressive pension funds (and endowments) beware!
Two points are crucial. The first is the inverse relationship between starting valuations and likely future returns; when valuations are high, future returns are low and vice versa. The second is a point I have been emphasising for years. While equities can be cheap or dear relative to bonds, the level of bond yields is a useful signalling mechanism for investors. High nominal bond yields are a sign that investors expect the future level of short rates and nominal growth to be high; high real rates give the same message about real growth. Low rates imply low growth expectations. Yes, bond yields have been manipulated downwards by central banks but central banks have indulged in these operations because they fear the growth outlook is weak. That has an implication for profits growth.
Admittedly, there is a very weak relationship between GDP growth and equity returns. But that seems to be because growth expectations are priced into markets; equities in weak economies are underpriced. That brings us back to the starting valuation level, which is still too high in the US (see the Shiller p/e, or indeed the dividend yield.)

Friday, January 25, 2013

What Apple Lost on Jan 24th vs......

Screen Shot 2013-01-24 at 4.33.13 PM.png

Why the world's biggest hedge fund missed big in 2012

Bridgewater Associate's Ray Dalio has long been one of the market's best seers. That could be coming to an end.

130123031810-ray-dalio-bridgewater-gallery-vertical
Bridgewater's Ray Dalio
FORTUNE -- Here's what needs to be asked about giant hedge fund Bridgewater Associates and its founder Ray Dalio: Is this guy really worth $2 billion a year? That's roughly the amount investors paid his firm in management fees in 2012.
That question got a lot tougher in the past 12 months for pension fund managers around the country, who for the past decade and a half have been funneling cash to Dalio and his firm, which now manages $142 billion - making it the largest hedge fund in the U.S.
That's because Dalio had a lousy 2012. By some reports, he was down for most of the year. Blog ZeroHedge appears to have a copy of Bridgewater's most recent client letter, which details how it did in 2012. Dalio's flagship hedge fund, Pure Alpha, ended the year up just 0.8%. That was much worse than the market in 2012. Stocks, as measured by the S&P 500, were up 13%. Bonds were up just over 4%. Even the average mutual fund manager, who gets paid far less than Dalio, was up 0.9% in the fourth quarter alone, just slightly better than Bridgewater did all year. For the full year, stock mutual fund managers were up 14%, handily beating Dalio.

Of course, every investor has off years. And Dalio is certainly entitled to one. Even with last year's flub, he still has one of the best track records of any investor. Pure Alpha has been up an average of 14% a year since 1991. Fortune, back in 2009, was one of the first major publications to profile Dalio and his success. So you could almost shrug off the $2 billion for an off year, I guess. (In good years, Dalio's company gets much, much more. In 2011, when his flagship fund was up 20%, his firm took in around $6 billion in fees.)
But a close look at Dalio suggests 2012 could be more than an anomaly.
Dalio generally believes most people get diversification wrong. They hold 60% of their portfolio in stocks and the rest in bonds, or some similar split, and call it a day. Dalio says stocks have historically been far riskier than bonds, so if you truly want to diversify your portfolio you have to put far more money in bonds than stocks.

According to the Wall Street Journal, Dalio preaches what he calls risk parity to institutional investors around the country, and has gotten a number of large pension funds to lever up their portfolios and buy more bonds. And they're doing this at a time when everyone appears to be growing more and more worried that the bond market could be in a bubble.

That sounds scary, but that's not the real problem. Dalio is, after all, about diversification. And he has recently joined the chorus of people who are warning that the bond market is overvalued.
If bonds do drop, Dalio's bets on stocks in theory should balance that out. The real problem is bonds are no longer the safe bet they once were. Rick Rieder, who is chief investment office of fundamental fixed income portfolios at Blackrock (BLK), says 30-year bonds were actually more volatile than stocks last year.
So Dalio's real bet -- that bonds are less risky than stocks -- is what was really off in 2012, and with interest rates at all-time lows that looks likely to continue for some time.
This is a simplistic analysis. Dalio only really practices risk parity with a little less than half of the money he manages. It's called the All Weather fund, which actually did better than Pure Alpha in 2012. Pure Alpha, on the other hand, as you can see from the numbers from ZeroHedge makes dozens of bets on all types of investments. But here too you can see the shift. Among the biggest movers in its portfolio recently are investments in US and European bonds. Its stock market investments, by comparison, have been less volatile.

Most people believe Dalio's success was built on his great macro calls, a swashbuckler able to stay one step ahead of the global economy. But while Pure Alpha is not the fully diversified All Weather, its outsized returns have been driven by the same general Dalio investment thesis: That investors have traditionally taken on too much stock market risk, and need to spread their bets.
That's been the true key to Dalio's success. And during a time of falling interest rates, it has worked great. And it may continue to. But it's also just the type of talk - that something like levering up your portfolio is safe as long as you use that leverage to buy bonds - that always pops up, and gets taken as gospel, just as bubbles are about to burst.

Ray Dalio: Cash Will Move Into 'Stuff' in 2013

Ray Dalio, founder of Bridgewater Associates, spoke with CNBC at Davos about a myriad of topics.  Dalio started Bridgewater with $5 million and now manages $130 billion.  His Pure Alpha hedge fund ended 2012 up 0.8% though his long-term returns are much more impressive.


Cash Will Move Into 'Stuff'

The Bridgewater founder thinks 2013 will be a year of transition as cash moves into 'stuff' like goods, services, financial assets (equities, gold, etc).

He points out that there's so much cash in the system due to central bank action.  Since cash has a negative real return, he argues that it has to go somewhere as risks are being reduced.  The desire to hold cash is being reduced. 

Dalio laid out his framework as essentially a scenario where US investors pile into stocks driving markets higher which will then give the Fed confidence to start to tighten, which will then cause a pullback across risk assets.


Bearish on Europe

However, he's quite bearish on Europe it seems noting that there's a terrible economy with a gradual restructuring.  He says there will be a depression there or a 'lost decade'.


Wisdom From Dalio

Dalio also had a some fantastic quotes about approaching investing, saying that,

"The way to look at any market... is to look at the buyers and sellers and to understand who's buying and who's selling and what the motivations are behind that."

He went on to note that,

"Too many investors are reactive decision makers... if something has gone up, they say 'ah, that's a good investment,' they don't say 'that's more expensive.'  It's the most common mistake in investing.  You have to look ahead and say what is the transaction? What will determine the buyer or seller?"

Dalio also points out:

"So much of the driver of any asset class returns is based on how events actually transpire relative to expectations. So there's a certain discounted growth rate in equities."

Lastly, Dalio made an excellent analogy comparing investing to poker:

"The bets are zero sum.  In order for you to beat me in the game, it's like poker, it's a zero sum game.  We have 1,500 people that work at Bridgewater, we spend hundreds of millions of dollars on research, and so on.  We've been doing this for 37 years and we don't know that we're going to win.  We have to have diversified bets.  So it's very important for most people to know when not to make a bet.  Because if you're going to come to the poker table, you're going to have to beat me, and you're going to have to beat those who take money.  So the nature of investing is that a very small percentage of the people take money essentially in that poker game away from other people who don't know when prices go up whether that means it's a good investment or if it's a more expensive investment."

This analogy is not a new concept and there are actually many similarities between poker and investing/trading.  Numerous hedge fund managers play poker (like David Einhorn) and we've highlighted the link between hedge fund managers and poker.

Thursday, January 17, 2013

Commodity volatility, where art thou?


Remember the whipsawing days of 2008? The days when commodity prices couldn’t get crazier?

Well, Goldman Sachs put out a research note this week clocking that things have got awfully quiet of late. Almost strangely so.
Indeed, according to Jeffrey Currie and team, commodity volatility has dropped far below the volatility of other asset classes, even though the risks to both the downside (macro and policy risk) and upside (geopolotical risks) have not gone away.
Perhaps predictably, they’re not a buyer of low volatility being a longer term trend.
You’ll be familiar with their argument. It goes like this:
On net, while we have sympathy for the view of a structural decline in long-term commodity price volatility, we believe the recent decline is too much too soon, both relative to commodity market fundamentals as well as other asset classes.
Furthermore, they believe “positive carry” will now be a big driver when it comes to curve positioning.
Again much like the 1980s and 1990s, we believe the price movements around these new stable “equilibrium” price levels are driven by short-term demand fundamentals with emerging market demand the key driver in the current environment. Despite concerns over “the end” of strong commodity demand from the emerging markets, recent micro and macro economic data from China point to continued strong demand, particularly for oil where we believe the weakness from last year was partially exacerbated by a de-stocking cycle.
Nice and logical.
But, they could be missing a big trick.
For one, they don’t really consider what’s driving the positive carry in the first place. Conventionalists would say that futures pricing lower than spot prices and offering “positive carry to investors” implies some sort of physical disequilibrium. That there is a shortage of supply in the market place, and that some level of destocking must take place.
The reason investors are rewarded with positive carry is because they are taking the risk of future “over supply” onto their own shoulders.
But, as we’ve argued, the positive carry signal and curve signals generally, have been warped by the zero rate phenomenon to some degree.
A little bit of positive carry does not, therefore, necessarily signal the same thing it used to. Especially if real negative rates are being masked by the nominal zero bound.
All that positive carry has to be compared to the negative carry you get from holding cash. Why would a producer destock, even in a backwardated market, if the cash they received in exchange would have a negative charge associated with it?
It’s much better to hold physical inventory. Especially if you can reap a small positive carry from doing so because futures haven’t quite figured this out yet. (This was the case for much of the post-crisis period.)
The fact that futures investors have finally realised they need to be compensated in the form of positive carry if they are funding producer inventory — which allows producers to dodge negative money charges — says little about disequilibrium in the market place.
It can, however, tell you a lot about low volatility and real interest rates.
As this paper by Joseph W. Gruber and Robert J. Vigfusson beautifully spells out, low volatility is always a product of low interest rates — especially in commodity markets.
And that’s because the lower the interest rate, the bigger the incentive to hold stock.
The more stock is held, the bigger the buffer to ease unexpected supply disruptions.
As for negative interest rates, these go even further. They don’t just incentivise the build up of stocks, in most cases, they incentivise complete production cuts.
It’s the negative interest artificial scarcity anomaly. If it doesn’t pay to hold cash, it pays to squeeze the market as much as possible instead.
Only if and when those production cuts lead to genuine shortage issues would a producer be incentivised to destock — at the right price — so as to cover genuine costs of operation and consumption needs. The point being: in a negative carry universe it does not pay a commodity owner to produce for monetary profit.
Indeed, the commodity asset is worth more if it’s not monetised at this point. This is especially the case if the futures market is already charging a negative carry for holding stocks above ground.
Explaining the crisis
In the run-up to 2008, it was thus the negative yield curve which arguably encouraged — albeit unwittingly — producers on all commodity fronts to undersupply the market. At least from a production point of view.
After all, why transform short-term liquid assets like commodities into cash if you have to invest them in negative yielding longer-term assets? It’s much better to hold the commodity. And if you do sell, you want to sell at the best price possible.
In our opinion, this negative yield force may even have contributed to the record high commodity prices of 2008.
But then, of course, came the crisis. Demand destruction set in, and the commodity market was once again — despite the best efforts of the industry — oversupplied. The high prices producers were using to overcome the costs of negative monetary carry were gone.
But, oversupply did present one new opportunity for producers and middle-men. It allowed them — at least temporarily — to scalp some much sought after positive carry from the futures market, a market which was — thanks to all those bullish bank notes to passive investors — still ready to pay handsomely for keeping supply around above ground.
Which brings us to now.
As we see it, it could be that Goldman Sachs is right. The period of low volatility will end soon, prices will either spike or fall — and today’s destocking will lead to a more bullish environment tomorrow.
Or, it could also be that futures investors have adjusted to the cost of carry in a negative interest world — which means forces and incentives are now in place to ensure price volatility is a thing of the past. Both on the upside and the downside.
On the downside, producers are back to controlling the market with supply cuts designed to keep prices only just above break-even levels, which satisfy their costs of operation and consumption needs.
Meanwhile, on the upside, prices are prevented from rising far beyond these levels because of lessons learned in 2008.
First, because the 2008 experience taught producers that pushing prices too high would only lead to temporary gains. In the longer run, prices which were too high would lead to demand destruction, price collapse, and — worse still — an economic incentive to seek out alternatives.

Second, because both Saudi Arabia and the US SPR – acting as implicit central banks of oil — now stand ready to cap prices if and when they begin to threaten to destabilise the system.
Under which scenario, it’s easy to imagine prices staying range bound for a long while still.
Of course, if volatility was to be let loose in an environment of negative yields — as it was in 2008 — we would arguably return to the more erratic cycle of artificially propped up prices leading to demand destruction, leading to price collapse, leading to society seeking out alternatives and weaning itself off commodity dependence.
The shale revolution in the United States fits that story beautifully, we think.

Lunch is for wimps

Lunch is for wimps
It's not a question of enough, pal. It's a zero sum game, somebody wins, somebody loses. Money itself isn't lost or made, it's simply transferred from one perception to another.