Saturday, October 09, 2010

Asness Encounters `Grim Reaper' Before Quant Fund Rebounds From 50% Loss


Clifford Asness, who runs AQR Capital Management LLC, one of the world’s biggest hedge funds, says fellow fund managers gouge their clients by charging exorbitant fees for just tracking the markets. He also takes a dim view of the administration of President Barack Obama, calling his economic team “Cossacks on a shtetl,” a reference to the Russian cavalrymen who sacked Jewish villages in Eastern Europe in the 19th century.
The hedge fund manager -- who is both a University of Chicago Ph.D. and a Marvel comic book collector -- is well known for his impolitic outbursts, Bloomberg Markets magazine reports in its November issue.
“What kind of coward doesn’t share his views?” asks Asness, 43, as he paces his office overlooking Long Island Sound in Greenwich, Connecticut. “I believe strongly that the world is going on the wrong course.”
Asness went the wrong way three years ago. From the start of 2007 through year-end 2008, AQR’s flagship Absolute Return fund fell more than 50 percent -- the kind of drawdown that’s often a death warrant for a fund. Firmwide assets tumbled to $17.2 billion in March 2009 from a peak of $39.1 billion in September 2007, according to AQR investors.
“I heard the Valkyries circling,” quips Asness, who says he identifies with action heroes like Captain America and Spider- Man. “I saw the grim reaper at my door.”
Smart Recovery
AQR survived. It did so by launching a campaign of diplomacy with its clients and offering a host of new funds and strategies. Asness’s funds have recovered smartly. Though the Absolute Return fund’s assets were down to $1.6 billion as of Aug. 31 from a peak of $4 billion, the fund rose 38 percent in 2009 and more than 10 percent through mid-September of this year, investors say.
As a quantitative investment firm, AQR uses algorithms and computerized models to trade stocks, bonds, currencies and commodities. Many quant funds got hit hard in 2007 and then again in the 2008 market crash.
“AQR has to fight against this current that’s going against them,” says Daniel Celeghin, a partner at Casey, Quirk & Associates LLC, a consulting firm in Darien, Connecticut. “They are one of the few quant firms that have managed to come back.”
AQR’s $1 billion Delta fund, opened in late 2008, returned 19.3 percent in 2009, an investor says -- beating Hedge Fund Research Inc.’s Fund of Funds Composite Index, which returned 11.5 percent. The fund was up 3.9 percent in 2010 through August versus a 0.3 percent loss for the HFRI index.
Asset Allocation
One version of AQR Global Risk Premium, a $3.9 billion asset allocation fund -- meaning it divides its investments across myriad markets -- surged 21.2 percent in 2009 and was up 17.2 percent this year through August, according to investors.
AQR has also been building a family of mutual funds for retail investors since 2008, with total assets in September of $2.3 billion. Three of them focus on momentum investing -- exploiting the tendency of securities to continue in their most recent trajectories. One invests in futures, and another bets on various kinds of arbitrage. Two trade foreign stocks. The latest, an asset allocation fund based on the Global Risk Premium fund’s strategy, rolled out October 1.
The firm markets the funds, which use quantitative models, through financial advisers.
Year to date through August, AQR has added $5.8 billion to its assets, which totaled $26.8 billion by the end of that month, according to investors. “It’s extraordinary to have had that kind of drawdown and then see them pull in their belts and come back so strongly,” says Tom Healey, founder of private investment firm Healey Development LLC, which invests with AQR.
Suffering Investors
Still, longtime investors in AQR suffered. The devastation of 2007 and 2008 gave the Absolute Return fund a negative record from its 1998 inception to its nadir in the market crash, according to a former employee. AQR declined to provide any fund returns for this article.
In early August 2007, AQR and some other quants found their programs had directed them into many of the same losing stock positions -- briefly costing them billions as markets short- circuited. Most funds quickly bounced back, only to plunge again in 2008 when stock, bond and commodity prices collapsed.
Research firm Lipper Inc., which tracks quant funds, says their number fell to 240 in July from 374 at the end of 2005. From the start of 2005 through June 2010, investment firms actively trading U.S. equities using quantitative strategies had a cumulative return of minus 1.15 percent.
Those using fundamental techniques -- traditional stock picking based on companies’ prospects and share prices -- had a cumulative return of 9.51 percent, according to EVestment Alliance LLC, an Atlanta-based research firm.
Four-Day Rout
The August 2007 quant rout unfolded over four days, probably after one or more firms tried to close out some of their positions, according toAndrew Lo, director of Massachusetts Institute of Technology’s Laboratory for Financial Engineering, who has studied the quant crash.
On Aug. 6, there was a rush to the exits. Stocks popular with quants collapsed as they sold, while those they were betting against soared as managers scrambled to cover short positions. On Aug. 10, markets rebounded. AQR Absolute Return, which had a peak-to-trough loss of 13 percent in August, finished the month down only 3.4 percent because it stuck with its positions.
The calamity of 2008 was far more wide ranging and enduring. The collapse of mortgage-related assets brought down the stock, bond and commodity markets globally. Absolute Return fell about 40 percent, according to investors. Now, Asness is working overtime to win back investors and make sure his algorithms perform.
Low Fees
One reason some of AQR’s funds attract investors is their low fees. The Delta fund offers investors an arrangement in which they pay a 1 percent management fee plus 10 percent of any profits it earns, versus the 2 percent and 20 percent typical of hedge funds. The fee rises or falls depending on how closely the fund tracks its benchmark.
AQR mutual funds charge as little as 0.49 percent, on a par with some of those offered by low-cost Vanguard Group Inc. Vanguard founderJohn Bogle says he’s impressed.
“He’s proved his point that he can do it at a reasonable cost,” says Bogle, who’s a fan of AQR research. “If I were a betting person, I’d bet he gives competitive returns.”
Asness’s low fees, positive performance and powers of persuasion have reassured investors.
Alaska Endorsement
“His ability to communicate in front of trustees is phenomenal,” says Jeff Scott, chief investment officer of the $36 billion Alaska Permanent Fund Corp., which invested $500 million with AQR in January, now spread among Absolute Return, Delta and Global Risk Premium. “These are people who are trying to solve our problems and not just raise money.”
On an August morning, Asness walks to his sun-dappled office windowsill and picks up a Captain America action figure. The hedge-fund mogul owns a panoply of action heroes, from the Hulk to the Silver Surfer, and the comic books that spawned them.
“I like to think of it as a much, much more affordable version of a money manager collecting art,” he says.
Though the wisecracks never stop, Asness is at the same time a demanding boss, two former employees say. One recalls being questioned about profit-loss updates on Thanksgiving.
And Asness admits to a temper: He’s knocked his ViewSonic computer monitor to the floor on three occasions, though it never broke.
“Either they’re building good computer screens or my punch isn’t what it used to be,” he says.
Grad School Ambiance
Asness calls the decor at AQR -- with its wood-paneled walls and spare furnishings -- “Goldman Sachs circa 1997.” In tone, however, the research process hums more like a finance graduate school.
“We try and run it like an applied academic seminar,” Asness says. “If you can get savage capitalists to rationally act like a team, then you have a beautiful thing.”
AQR’s trading is mostly automated, so there is little of the shouting and tumult that characterize some hedge funds. Partners, traders and analysts sit on a trading floor in a dozen rows, with some senior researchers taking the windowed offices. Academics are invited to give talks on subjects ranging from behavioral finance to accounting rules.
A Plethora of Funds
AQR manages some 65 funds of various stripes, and often tailors core strategies to meet client needs -- using more or less leverage, for example. The firm has adapted its models to trade in everything from the Polish zloty to Japanese bonds, to oil, gold and wheat. Asness says the myriad strategies and markets provide the extra safety that comes with spreading one’s bets.
Example: AQR uses its models to run traditional long-only funds, seeking to beat a benchmark by a few percentage points while limiting risk.
“We really believe in diversification of all kinds,” Asness says, adding that it especially helped during the meat grinder of 2008. “It did make it a lot easier to stay the course.”
Even as he works to outsmart volatile markets, Asness continues offering opinions on everything from Broadway musicals to overhauling U.S. health care. Asness performs across all media, writing opinion pieces for newspapers and magazines, talking on television shows and at conferences and contributing to websites.
“It’s almost like he can’t help himself,” says Theodore Aronson of Philadelphia quant firm Aronson + Johnson + Ortiz. “He’s afraid of no one and is not capable of telling a lie. It’s not the usual pablum.”
E-Mail Blasts
Asness sounds off most frequently in e-mail blasts to a personal network of friends, family and investors. One sarcastic example, from March, concerned a U.S. Senate move to create a federal office to predict financial crises.
“This is definitely going to work,” he wrote. “No more bubbles. These geniuses will get it right. Promise. And all for a government salary.”
Asness admits to a superhero complex. His favorite Marvel comic book character is Captain America, who gains strength with the help of a secret serum and whose shield can be used as an indestructible weapon. Asness has an image of the shield tattooed on his left arm.
“His super-villains are intellectual dishonesty and ignorance,” says Jonathan Beinner, a managing director at Goldman Sachs Group Inc. and a former classmate of Asness. “When someone offers an opinion that Cliff feels is incorrect or dishonest, whether it be related to investments, politics or pizza, he feels it is his duty to stand up, even if it’s not in his best interest.”
‘Frigging Idiots’
In August, Asness was complaining about Obama’s health- care law, which he calls socialized medicine, the increased powers Congress gave financial regulators and the tendency of commentators to blame banks alone for the crisis.
“Everyone dropped the ball on this; the public acted like frigging idiots,” he says. “There were sins of individuals, sins of banks, sins of government.”
Asness’s views are not always predictable. He has praised Tea Party activists, blogging in March, “Your aggressive stand for freedom and small government has inspired the country.” At the same time, he endorses the American Civil Liberties Union’s campaigns to guard civil liberties.
With AQR in comeback mode, Asness is in good humor as he bites into a piece of spicy tuna roll sushi one August afternoon at AQR’s offices. Around a conference room table are two of the three other founding AQR partners. David Kabiller, 47, a former Northwestern University tennis champion, heads client relations and favors Tom Ford blazers.
School Pals
John Liew, 43, is a former Asness classmate at the University of Chicago Graduate School of Business, where they both earned Ph.D.s in finance. He heads AQR’s global asset allocation team.
The fourth founding partner, Robert Krail, also a University of Chicago alum, is on medical leave.
AQR was buttressed by some key decisions during 2007 and 2008, Asness says. For example, the firm didn’t panic and pull the plug on its models. “We believed in the models,” Asness says. While that punished AQR in the sell-off, it left the firm positioned for the rebound beginning in March 2009.
“It’s riding a statistical beast,” he says. “Having a lodestone to come back to helps.”
AQR has tried to keep its investors loyal by keeping them well informed of its strategies for battling the market turmoil.
“Clients want to hear from us,” Kabiller says. “People have a negative view of a black box.”
No New Restrictions
The firm didn’t impose new restrictions on investor redemptions, as many funds did.
The firm did make some changes. Now, a big stock sell-off will automatically trigger systems that reduce leverage at various thresholds, cut back on risk and raise cash.
Like many quant firms, AQR is grounded in the efficient market hypothesis, or EMH, promulgated by professor Eugene Fama of the University of Chicago, who was Asness’s Ph.D. thesis adviser. Fama, 71, and his adherents say that the stock market is effective at digesting the available information about an asset and setting the right price for it.
EMH lost a lot of its luster in the sell-off, when the Standard & Poor’s 500 Index fell 57 percent in 18 months. “From a macro perspective, the market has been woefully lacking in trying to figure out what the valuation of an asset should be,” says Justin Fox, author of “The Myth of the Rational Market” (HarperBusiness, 2009).
“People had an idea that the market was effective at sussing things out. That’s been discredited.”
Not Perfectly Efficient
Asness doesn’t believe any market is perfectly efficient.
“We aren’t believers in the extreme form of the efficient market hypothesis and shouldn’t have to defend it,” Asness says. “EMH says ‘prices reflect all information,’ and I think the tech crash and the real-estate bubble culminating in 2008 were real blows to that idea.”
AQR’s business, in fact, is to find inefficiencies in the markets and profit from them. AQR researchers examine variables that over time generate higher returns, or premiums. Fama and Kenneth French, who now teaches at Dartmouth College, in 1992 published research showing that stocks with high book values relative to their prices outperformed those with low book values. The difference between the two is known as the value premium. The book value of a company is its net worth.
The same research found that small-capitalization stocks outperformed large caps.
Value Premium
Quants such as those at AQR have found ways to apply the value premium to different markets and asset classes, like currencies and bonds -- or even whole countries. Asness and colleagues might add up the market valuation of stocks in France and Germany, compare them with the earnings or book values of the listed companies and conclude that one of the countries’ stocks are undervalued.
Another variable that generates a premium is momentum -- the tendency of a stock’s price to continue upward if it is rising and downward if it’s falling. Asness, in his 1994 Ph.D. dissertation, was among the first to show the existence of a premium tied to momentum, Fama says.
The value and momentum premiums drive more than half of AQR’s returns, Asness says. Another model AQR uses asserts that the stocks of companies that are reducing their share count tend to outperform those of companies increasing it.
“We think they all make money more often than not,” Asness says.
Lawyer’s Son
Born in the borough of Queens, New York, Asness may have inherited his entrepreneurial streak from his mother, Carol, who ran a medical education firm. His father, Barry, was an assistant district attorney in Manhattan. Asness’s younger brother Bradley would follow in their father’s footsteps; he took up law and is now general counsel at AQR.
“He’s 6 foot 2, has all his blond hair, and I am bitter,” Asness deadpans.
Cliff Asness is 5 foot 10 inches (1.8 meters) tall and weighs 200 pounds (90 kilograms). He is bald with a graying beard.
Asness wasn’t an academic star at Herricks High School in New Hyde Park, New York.
“I had a mediocre record in high school,” Asness says. “I was desperately trying to get girls interested in geeks.”
His destiny, according to the 1984 yearbook: “Rich.”
Summa Cum Laude
Asness earned two B.S. degrees at the University of Pennsylvania, one from the Wharton School and the other from what is now the School of Engineering and Applied Science, graduating summa cum laude.
“I believed in diversification even then,” he says.
The future hedge fund mogul made his presence felt on campus.
“He was the king of the geeks,” says Beinner, a dorm mate in Asness’s freshman year who’s now chief investment officer of Goldman Sachs Asset Management’s fixed-income unit. “Cliff just had a following. People were always asking him questions when he was hanging around the computer lab.”
Lo, then a Wharton School professor, hired Asness as an assistant. Lo eventually started his own quant firm, AlphaSimplex Group, now part of the French bank Natixis.
“He would run regression analyses for me,” says Lo, referring to the process used to find relationships between variables for the purpose of predicting future values. “Given his background in computer programming and finance, he was perfect.”
Chicago Bound
Lo wrote Asness a recommendation to the University of Chicago Graduate School of Business, now the Booth School of Business, and soon he was off to America’s citadel of free- market thinking.
Asness became one of Fama’s favorites.
“Cliff was among the smartest students to pass through,” Fama says. In 1990, Asness became the efficient-markets guru’s teaching assistant, putting him on track for an academic career.
“I thought he had the potential to make an excellent professor,” Fama says.
A summer job at Goldman Sachs, engineered with help from Beinner, sent Asness in a different direction. In 1992, he signed on for a one-year research job. In 1993 and 1994, the Ph.D. candidate found himself struggling to complete a 150-page thesis while logging 80-hour weeks for Goldman. In 1994, the investment bank hired him to build a quant research department.
$1 Million Classroom
Although they’re friends, Fama says he remains irked that Asness didn’t pursue an academic career.
“We invested a lot of time and effort in Cliff,” he says. Asness donated $1 million to name a classroom after Fama. “He should name another,” Fama says.
At Goldman, Asness recruited future AQR partners Liew and Krail, two former classmates from the University of Chicago who worked at Trout Trading Co. In addition to building trading models, the Quantitative Research Group crunched numbers and drew charts to help guide the bank’s traditional stock pickers and other managers. Asness also started what was then a small hedge fund for Goldman called Global Alpha -- which would grow to $11 billion in assets by 2007.
Under Asness, Global Alpha scored gains of 111 percent in 1996 and 42 percent in 1997. He grew frustrated with his other duties.
“We thought it was crazy that they wouldn’t let us focus on investing alone,” Asness says.
Two Sets of Twins
Asness, Liew, Krail and Kabiller, who had worked in Goldman’s pension services group, decamped to start AQR in 1998. In 1999, Asness married Laurel Fraser, a former Christie’s International salesperson, who before they dated had been his executive assistant at Goldman. They are parents of two sets of twins, born 18 months apart.
AQR started with $1 billion, Asness says. It began trading in August 1998 -- when the bubble in Internet and other technology stocks was in full bloom. AQR followed its models, betting against expensive stocks and buying cheap ones. That meant Absolute Return hemorrhaged money until the market turned against tech in March 2000.
“We began with $1 billion and through hard work and acumen turned that into $400 million,” Asness jokes.
The founders toured the world, trying to persuade investors that the tide would turn. In 2000, Asness penned a paper called “Bubble Logic,” in which he picked apart the arguments supporting sky-high technology stock valuations.
“When fallacies rule the land, somebody has to point out the naked emperor,” he wrote.
Market Turn
In March 2000, the market turned and Absolute Return began making money. The fund finished 2000 up 16.7 percent, investors say. The Nasdaq Composite Index lost 77.9 percent of its value between March 2000 and October 2002. From there, AQR flourished, with assets rising to $12 billion in 2004, when the firm moved to Greenwich.
A key lesson of 1998 to 2000 was replayed less than 10 years later.
“No strategy is so good that it can’t have a bad year or more,” Asness says. “You’ve got to guess at worst cases: No model will tell you that. My rule of thumb is double the worst that you have ever seen.”
The firm has also redoubled its effort to develop new strategies for boosting returns and improve existing ones. John Cochrane, the AQR Capital Management Professor of Finance at the University of Chicago, says many quants just mine past data and extrapolate returns.
‘Really Analytical’
“AQR is really analytical,” he says. “They put a lot of academic research to work -- and they create a lot of academic research.”
The Delta fund is one result. Drawing on years of analysis, the fund is based on the notion that some of the investing techniques used by hedge funds, such as merger and convertible bond arbitrage, aren’t as sophisticated as they’re cracked up to be.
Merger arb hedge funds typically buy the stock of acquisition targets and sell short that of acquirers. Convertible arbitrage often involves buying a convertible bond and shorting the corresponding stock, locking in the yield.
AQR’s research showed that with the right formulas programmed in, the buying and selling of stocks and bonds for merger and convertible bond arbitrage could be automated. And that’s what the Delta fund is: a kind of systematic hedge fund using multiple strategies.
“It’s sexy in a wonkish sort of way,” Asness says.
Balancing Risk
The Global Risk Premium fund is another example. Research showed that pension funds that use traditional, balanced asset allocation formulas -- say, 60 percent stocks and 40 percent bonds -- are actually unbalanced in terms of risk. That’s because stocks, which are much more volatile, may account for 85 to 90 percent of such a portfolio’s risk.
The Risk Premium fund puts money to work in a variety of asset classes -- stocks, bonds, commodities and others -- to spread risk more evenly. The amount of volatility a pension investor wants in order to get to a desired return is adjusted with leverage.
Asness and colleagues say they’re tweaking formulas at the fortified Absolute Return fund so that it can return to its former prominence in the firm.
“AQR believes in preserving capital by managing risk,” says the Alaska Permanent Fund’s Scott, who’s targeting returns of 5 percentage points above inflation going forward. “The returns are working, but the bigger picture is working too. What we found with Cliff is, he rolls up his sleeves and teaches us.”
Post-Crash Blues
Around the developed world, expectations for future investment returns have withered following the financial crisis and the drawn-out recession. Asness realizes that AQR won’t soon return to the fat margins of pre-crash days.
“The whole industry is less lucrative than it used to be,” he says.
How will AQR define its own success in an era of tempered hopes? More assets? Higher profits? Asness -- father of four, self-declared family man -- gives an answer he knows will get him in trouble at home.
“Two words,” he says, pausing for effect with a smile. “Trophy wife.”
There goes the bigmouth again.

Blackstone's Byron Wien on the next George Soros


The Blackstone advisor and market prognosticator talks about hedge fund fees, the Volcker Rule, and what to expect next year.Byron Wien
Let's be honest: the bulk of Wall Street analysis is dry-as-dust. It's chock-full of spreadsheets, earnings estimates, and clunky jargon. The financial strategist and commentator who manages to publish an interesting read is a rare breed indeed. Even in that select group, Blackstone's Byron Wien stands out for the consistently engaging quality of his work.
The chief investment strategist at Morgan Stanley (MS) for 21 years, Wien had a brief gig at Pequot Capital before landing his current role as senior advisor to both Blackstone (BX) and its clients in analyzing economic, social, and political trends. His latest dispatch, on the evolution of the hedge fund industry, offered his usual mix of perspective and insight. We caught up with Wien to further explore this most powerful segment of the markets.
You discuss a number of changes in the industry over the past few decades, not the least of which was the huge growth in assets under management from $40 billion in 1990 to $1.6 trillion today. That growth aside, what do you think is the biggest difference between today's hedge funds and those in the swashbuckling era of Soros and Steinhardt?
The biggest difference is that early hedge funds were dedicated to superior performance on the upside and were willing to experience higher than normal volatility to get it. Current hedge funds are interested in asset protection on the downside and will give up upside points to get it. It's a major change, from a focus on upside performance to a focus on downside protection.
I would ask you who the George Soros of today is, but I think it might still be George Soros. True?
Soros is still focused on performance, if that's what you mean. But it's pretty much all his money and that of his foundation.
So who will be the next Soros?
The thing about Soros is his consistent performance over a long period of time. In that light, you could make a case for Stan Druckenmiller or John Griffin.
You point out that the Volcker Rule will likely benefit hedge funds, in part as brokerage firms shut down their proprietary trading desks. Is this an instance where high-minded policy might have an unintended effect? That big risky trades move farther into the shadows than previously?
Those trades are surely moving beyond the purview of adult supervision. It may actually lead to more destabilizing risk than less. Before, proprietary trading, hedge funds, and private equity might have added some risk to the financial institutions that sponsored them. That's what Volcker focused on. Now that they are spun out, they may lend more instability to the markets themselves. The institutions may be alright, but the markets may be even more destabilized as a result.
There's still no agreement over the role of hedge funds, particularly with respect to short selling, in the crisis of September 2008 and even the fall of Bear Stearns. Did they play a meaningful part?
There is $178 trillion in financial instruments out there. Hedge funds accounted for $1.9 trillion at their peak. There may be more money at the margin, because they are more active, but the idea that they brought on the crisis is ridiculous. It makes less sense than blaming China's currency on unemployment problems in the United States. I think they're a legitimate investment enterprise today. They allow pension funds to minimize their risk in difficult markets.
One thing a lot of us learned about in the wake of the credit crunch was this whole concept of the shadow banking system, in which hedge funds had become a significant part of the underlying mechanism of credit in the economy. Are they still a vital part?
I think they are. But I view that as a positive, not a negative. It broadens the markets and it creates competition. I can't think of a bad thing about it.
Can a hedge fund be too big to fail?
No hedge fund will ever get that big. Size is the enemy of performance.
But do we need to be concerned about black box funds like James Simons' Renaissance Technologies having a computer bug that causes a flash crash? Or about hedge funds' groupthink causing another credit or liquidity crisis?
Let's go back one step here. Throughout the financial crisis, the federal government didn't have to put up one single dollar to help out a hedge fund. They suffered, but never went to Washington with their hands out. Does that answer your question?
How is it possible that hedge funds continue to command the fees that they do — the so-called "2 and 20", which is 2% of assets under management and 20% of performance? Even if they perform well, it's still a sizable fee to pay for money management. Why hasn't there been compression?
It's a very high fee. I always thought it would be revised. I once wrote an essay in which I offered an alternative fee schedule where you had to beat your stated index. You would earn only the management fee up until your performance equaled your benchmark, and then you got 50% of performance beyond that. I'm pretty sure no one adopted it.
There are some funds that are cutting fees. They are going to "1 and 15" or "1.5 and 15." But they're cutting them for lockups. If you agree to lock up your investment for three years, you might get "1.5 and 15." But the great lesson of the hedge fund industry is that you can't compete on fees, which is a sharp contrast to the long-only industry. In hedge funds, you can cut your fee as much as you want and you will still lose money. Those that deliver performance can charge "2 and 20." Those that don't are more likely to be doomed.
You point out a notable statistic – that Exchange Traded Funds (ETFs) now make up 30% of NYSE trading volume, up from 15% just five years ago. Is that something we need to be concerned about for any reason?
Probably. It's a lazy man's way to get exposed. Here's what you have to worry about. People don't know exactly what they're getting. Let's say someone decides that they want exposure to China, India, and Brazil. People go and buy an ETF from Brazil. But the ETFs from Brazil are primarily weighted along market capitalization lines. [Oil & gas producer] Petrobras is the largest company by market cap in Brazil. So if you buy that ETF, you are really buying an energy ETF. The success of that ETF will be dependent on what happens to energy stocks, not necessarily the Brazilian market. If you are lazy and you don't analyze your ETFs, you may not be getting what you think you're getting.
Everyone looks forward to your ten annual surprises essay published at the beginning of every year. Want to give us one in advance?
I'm not sure I can help you there. I start work on that on October 1, and it's October 7 today. And it's going to be hard this year. But here's one for you: Right now almost everybody is disillusioned about the administration and they're not optimistic about the economy. It would be a big surprise if next year turns out to be a very good year. We have some structural impediments that are quite significant that can get in the way of that, but that's would make it a surprise.

Thursday, September 30, 2010

Shrinky Dinks: The Yield Curve Edition

With long-term interest rates sinking, the slope of the yield curve is becoming increasingly more flat.  Given that short term interest rates are near zero, every decline in the long end of the curve causes the curve to flatten.  The spread between the yield on the 10-year and 3-month US Treasury has been shrinking rapidly in 2010.  After peaking out above 350 basis point (bps) in late 2009 and early 2010, today the spread broke down to its lowest level since January 2009.

Friday, September 17, 2010

Congressmen Weiner and Waxman Set Gold Hearing

Just as the government is trying to prevent people from investing in anything other than T-Bills by raising taxes on taxable interest and dividends to confiscatory levels, it's also trying to prevent you from parking your wealth in assets, like gold, that compete with the paper dollars issued by the Federal Reserve and the Treasury. A press release from Rep. Anthony Weiner, Democrat of New York, not yet (as of this instant) posted on Mr. Weiner's Web site, announces that a September 23 hearing of the Subcommittee on Commerce, Trade, and Consumer Protection (a subcommittee of Rep. Henry Waxman's Commerce Committee) will focus on "legislation that would regulate gold-selling companies, an industry who's [sic] relentless advertising is now staple of cable television."

From the press release: "Under Rep. Weiner's bill, companies like Goldline would be required to disclose the reasonable resale value of items being sold." That's great. Are Mr. Weiner and Chairman Bernanke also going to agree to print on every dollar the reasonable expectation that its value will be eroded by inflation?
Gold investors (or speculators) are already punished by the federal government by having their investment, even in a gold exchange-traded-fund, taxed at the higher rates that apply to collectibles rather than long term capital gains.

Not to mention the fact that Mr. Weiner's regulatory push seems as much aimed at conservative journalists as at the gold-dealers. The press release says, "Goldline employs several conservative pundits to act as shills for its' [sic] precious metal business, including Glenn Beck, Mike Huckabee, Laura Ingraham, and Fred Thompson. By drumming up public fears during financially uncertain times, conservative pundits are able to drive a false narrative. Glenn Beck for example has dedicated entire segments of his program to explaining why the U.S. money supply is destined for hyperinflation with Barack Obama as president."

Imagine the uproar if a Republican-majority Congress started investigating and having a regulatory crackdown on big advertisers in liberal outlets such as the New York Times. The First Amendment freedom-of-the-press crowd would be marching in the streets.

The whole situation is amazing. If Mr. Weiner really wants to calm fears about hyperinflation, the last way to do it is to have a government hearing cracking down on the people warning of it.
The press release reports that "invitations to the hearing have been sent to the representatives of Goldline International, the Federal Trade Commission, the Consumers Union and other potential witnesses, including former Goldline employees." Mr. Weiner might also consider calling John Paulson and George Soros, who have also reportedly been buying gold lately, though Mr. Soros was also quoted as calling it a bubble. But Mr. Paulson saw the housing bubble coming so he might be right about the inflation risks, and Mr. Soros is a big funder of left-wing causes, so neither of them would fit with the objective of the hearing.
Anyway, we are looking forward to the hearing, which should be quite a show.

Monday, September 13, 2010

MUTUAL FUNDS ARE “ALL IN”

Eric King posted this interesting chart showing mutual fund cash levels.   According to King mutual fund cash level has declined to its lowest levels ever:
“The percentage of liquid assets (aka mutual cash levels) was 3.4% in July.  This is the lowest percentage cash level ever and is near levels that accompanied the 2007 equity market peak.”
king1 MUTUAL FUNDS ARE ALL IN
You’re likely familiar with the myth of cash on the sidelines, however, if mutual fund managers are any sign of bullishness it’s clear that they’re quite bullish. The last two times we witnessed cash levels near these levels were directly before the 1999 market implosion and the 2008 market debacle. Surely it’s unwise to use any single indicator to make market decisions, however, this is one macro indicator that is worth noting.

Friday, August 27, 2010

CFA or MBA?

Are a CFA designation, an MBA degree and experience critical success factors for fund managers? In their July 2010 paper entitled “Are You Smarter than a CFA’er? Manager Qualifications and Portfolio Performance”, Oguzhan Dincer, Russell Gregory-Allen and Hany Shawky examine the impact of having an MBA, a CFA and/or investment experience on investment manager performance. They control for market conditions and investing style and seek robustness of results by using five portfolio performance and two risk measures. Using fund performance data and manager characteristics for a sample of 890 managed equity and fixed income portfolios free of survivorship bias over the relatively calm period of 2005-2007, they find that:
  • 40% of key portfolio managers hold a CFA designation, 28% have an MBA degree and 18% have both. 46% (35%) of funds have at least one CFA (MBA) on the management team. The average job tenure for key portfolio managers is about 12 years.
  • On average over the sample period, managed funds beat the S&P 500 Index by 0.06% per month, with a monthly four-factor (market, size, book-to-market, momentum) alpha of -0.08%.
  • The 890 funds in the sample employ 32 different benchmarks, with about 8% of funds changing their benchmarks during the sample period. The most commonly used benchmarks are the S&P 500 Index (21.6%), Russell 1000 Growth Index (14.5%) and the Russell 1000 Value Index (11.4%).
  • Considering the full array of performance measures, along with risk and style adjustments, there are no differences in fund performance reliably attributable to CFA designation, MBA degree or experience level, either separately or in combination.
  • However, there is evidence that portfolios managed by CFAs tend to have lower risk than portfolios managed by MBAs. There is some evidence that experience also relates to lower portfolio risk.
In summary, evidence from an array of tests does not support beliefs that CFA designation, MBA degree and level of experience are critical success factors for investment managers.
See also “What It Takes to Drive the Big (Hedge Fund) Rigs”.

Thursday, August 05, 2010

Kass: Short Bonds

Doug Kass

08/04/10 - 02:00 PM EDT
This blog post originally appeared on RealMoney Silver on Aug. 4 at 7:52 a.m. EDT.
As stocks begin to challenge my upside S&P 500 target of 1,150 (in a range between 1,025 and 1,150), I would now reduce stock positions in the belief that shorting the U.S. bond market, via a ProShares UltraShort 20+ Year Treasury (TBT) long, provides a better downside risk/upside reward ratio than owning the S&P now.-- Doug Kass, "A Risk-On, Risk-Off World"
I would not get caught up in the optimism that has surrounded the sharp ramp up in the indices since early July.
Indeed, in yesterday's opening missive, I argued to further reduce long exposure as we traveled toward the higher end of my expected second-half trading range in the S&P.
continue to believe that the July 1 lows will not be revisited in the months ahead as the hyperbole surrounding a double-dip in the domestic economy has abated, along with steady improvement in certain risk metrics and risk markets (e.g., junk bond yields down, euro up, industrial commodities higher, two-year swaps down).
Nevertheless, the ambiguity of the economic soft patch grows daily and was reinforced by Tuesday's sluggish data (factory orders, pending home sales, personal income and spending were all weak). Moreover, a reduction in inventories and some other influences now point to a revision of second-quarter GDP to under 2% later this month.
Since the generational low, I have argued that we are in a period of inconsistent and uneven economic growth that will be difficult for corporate managers (who do not have pricing power and face tepid top-line growth) and investment managers to navigate. In this anticipated sloppy setting, it will sometimes appear, in the quarters ahead, that we are reentering a recession. At other times, it will appear that we are reentering an expansionary phase.
Lumpy growth and the emergence of nontraditional headwinds (fiscal imbalances at the federal, state and local levels, higher marginal tax rates, a costly and burdensome regulatory backdrop, etc.) will serve to cap the market's upside.
Supporting the market (among other factors) will be low interest rates and reasonable P/E multiples (especially when viewed vs. generational low interest rates and quiescent inflation).
As well, the risk premium (S&P earnings yield less the risk-free rate of return in fixed-income) is at the highest level since 1980, when the bull market started. This means that stocks are cheap relative to bonds and/or bonds are way overpriced and possibly in bubble territory.
As I wrote yesterday, I tip in favor of shorting bonds over being long stocks. I believe that my downside in a bond short is limited and, if stocks rally, the reasons behind that rally (economic clarity) could produce a larger drop in fixed-income than a gain in equities.
How expensive are bonds? Consider, that at a 2.89% yield on the U.S. 10-year note fixed-income is priced at a P/E multiple of 34.5x (the inverse of 2.89%) against the S&P's P/E multiple of only 12.0x.
Regardless of one's views, erring on the side of conservatism seems to be the preferable course of action, especially after the sharp rise in the U.S. stock market.

Yield Wins in the Long Run


WSJ (hat tip Abnormal Returns):
Bonds continue to trounce stocks, sending mixed signals to investors and raising the question: Are stocks too cheap or are bonds too expensive?

After consistently lagging behind bond performance this year, stocks appear historically cheap compared with bonds, offering investors reason to favor stocks, particularly if they are optimistic about the economic outlook.
EconomPic has detailed this quite a bit over the past few months:
Back to the WSJ detailing how things have played out:
So far this year, the stock market's total return is slightly negative, while normally staid investment-grade corporate bond returns are up nearly 8%, according to Bank of America Merrill Lynch indexes. Even risk-free Treasury returns are up 6%.
This equity-like performance of high quality bonds can not continue. At some point the level of yield... wins. With the current yield to worst of the "Barclays Agg" index at less than 2.6%, investors expecting anything more than 2.6% over the next 4-5 years (i.e. the duration of the index) will be disappointed.


As for risk assets... as I detailed in my post Investing in a Low Return Environment my guess is that while high real returns are possible, there is a lot of risk out there.
And THAT'S the problem with investing these days (and not just with bonds). With risk-free rates hovering near zero, an investor must take a much larger amount of risk to achieve any level of absolute return. This concept is even more meaningful for an investment in risk assets, such as equities and commodities, as the downside risks of those asset classes are MUCH higher than even the worst case rising rate scenario on an investment in the BarCap Agg.
Source: Barclays Capital

Pushing on a string


In an equity-centric world it sometimes easy to forget the unforgiving mathematics of bond pricing.  Unlike equities, fixed income securities have limits on their potential for capital appreciation.  Bond prices can only escape the inevitability of par for so long, absent a trip to bankruptcy court.  As the yield curve continues its path downwards the attempt to squeeze excess returns from the bond market becomes more like pushing on a string.
One can see from the chart below the downward moves in both the Treasury and BBB-corporate bond curves.  The moves are especially pronounced at the short end of the curve.

Source:  research puzzle pix
In today’s financial markets it seems that we are beginning to see some of these limits come into play.  For example IBM was recently able to issue 3 year bonds at 1%.  Even an instantaneous drop in the yield by 50 bp yields only a 1.5% rise in the price of the bond.  In short, absent earning the coupon there is little in the way of capital appreciation opportunity here.
The aforementioned is an extreme example due to both its coupon and maturity, but it is indicative of the situation facing the overall bond market. Given the puny yields on so-called safe investments like bank deposits and Treasury securities it should not be surprising that individuals are in a desperate search for yield.  Cash has been flowing out of money market mutual funds in search of higher yields.
Given the recent performance of high yield bonds this is not surprisingly a likely destination for some of this cash.  Investors have been pouring money into high yield bond funds as defaults ebb.  From a Bloomberg article one fund manager called the market behavior “a little big bubblelicious.”  The risk is that individuals don’t know exactly what they are getting themselves into.  As Carl Richards wrote a few months ago:
One of the things that I’m most worried about right now is people taking money that they want to keep safe and trying to find investments that earn a yield that’s a little higher. This is called “stretching for yield,” and it can be be a dangerous game, especially if you don’t understand the rules.
The logical conclusion is to short the bond market, right?  Some analysts like Doug Kass are currently recommending that approach.  Kass argues for getting long the ProShares UltraShort 20+ Year Treasury ETF (TBT).  While this approach is technically easy, one should recognize that this approach comes with some costs.  Those include the feeds of the underlying ETF and the costs of carrying the short bond positions themselves.
The other bigger picture issue to deal with is the case of Japan.  Japan has been mired for nearly the past two decades in a low-growth environment.  This has lead to 10-year JGBs now trading with a yield below 1.0%.  If one is an ardent believer in the deflation case, then current government bond yields may not seem all that high in the future.
In any event we should all get used to the notion that we are investing in a low nominal return environment.   Some interesting charts at EconomPic Data highlight the limits we are now facing in the bond market.  We should view future returns through the lens of current yields:
This equity-like performance of high quality bonds can not continue. At some point the level of yield… wins. With the current yield to worst of the “Barclays Agg” index at less than 2.6%, investors expecting anything more than 2.6% over the next 4-5 years (i.e. the duration of the index) will be disappointed.
There a number of implications from this discussion.  Included in this would be pension funds having to revisit their rate-of-return assumptions.  Playing a reversal in this interest rate trend remains an option, but it is not a risk-free one.  The bottom line is that fixed income investors need to face up to the realities of current bond prices and brace for an extended period of diminished returns.

Thursday, July 29, 2010

Got Yield?


A month back I detailed that the aggregate bond index (i.e. the Barclays Capital Aggregate made up mainly of Treasuries, Corporates, and Agency MBS) hit an all-time low yield of 2.94%. One month later that looks lofty as the yield to worst hit 2.71%.

Aggregate Bond Index YTW by Sub-Sector


Source: Barclays Capital

Wednesday, July 21, 2010

Is someone liquidating GLD?

In the old(er) days, it was generally said that gold traded in an inverse relationship with the dollar and also, to a lesser extent, other risky assets.
Yet, gold sold off sharply in June:


But the S&P 500 also saw a fall:

And the dollar has also been declining:

Which might be a tad confusing.
So what’s really behind the gold move?
Well, according to Reuters one particular equitised gold product is experiencing rather sharpish outflows in holdings. That would, of course, be the SPDR GLD exchange traded fund (ETF).
As the newswire reported on Tuesday:
The world’s largest gold-backed exchange-traded fund, SPDR Gold Trust said its holdings fell nearly 0.5 percent to 1,308.128 tonnes by July 20 from 1,314.211 on July 15. The holdings hit a record at 1,320.436 tonnes on June 29.
To see how that ties with the gold price one would have to chart GLD’s historical assets under management or shares outstanding. Unfortunately, the GLD SPDR goldshares’s website doesn’t offer archived data on this, only the last noted assessment.
So we’ve done the next best thing.
Thanks to a previous enquiry, we had data up until end-of-May and have updated the chart with the latest shares outstanding figure from the website. Here’s how it looks:

Of course, there might be a perfectly reasonable explanation for that drop.
Some have noted, for example, that iShares’ competing gold product (IAU) slashed its management fees this month in a bid to woo other assets. As IndexUniverse observed:
Did IAU Just Steal $59 Million From GLD?
It’s too early to call it a trend, but it’s tempting to see one after ETF-share creations last Friday on iShares’ Comex Gold Trust (NYSEArca: IAU) fund were virtually identical to redemptions on State Streets’ SPDR Gold Shares ETF (NYSEArca: GLD).
Net flows into the iShares ETF on July 9 were $59.2 million, a 2 percent increase, which raised total assets after market movement to $3.47 billion, according to data compiled by IndexUniverse.com. Outflows from GLD were $59.1 million, a tiny setback for the second-biggest U.S. ETF, which has more than $51 billion in assets.
The movements came about a week after iShares slashed the price of its gold fund, moving the annual expense ratio from 0.40 percent to 0.25 percent on July 1.
And here’s how IAU’s shares outstanding compare:

Of course, that still doesn’t really explain the impact on the gold price . . .

Rogue Waves and Hedge Fund Returns

How exposed are hedge funds to “rogue” correlations, wherein returns of assets or asset classes that normally exhibit hedging cancellation instead exhibit hedge-killing reinforcement? In the June 2010 version of their paper entitled “‘When There Is No Place to Hide’: Correlation Risk and the Cross-Section of Hedge Fund Returns”, Andrea Buraschi, Robert Kosowski and Fabio Trojani investigate the exposure of hedge funds to correlation risk (risk of unexpected changes in the correlation between the returns of different assets or asset classes) and the implications of this risk for hedge fund returns. Using data for actual one-month-to-maturity  S&P 500 correlation swaps (based on daily implied versus realized correlation), individual S&P 500 stock and index put and call options and a broad sample of 8,710 individual hedge funds spanning in combination January 1996 through December 2008, they find that:
  • Rogue correlations tend to occur during market crashes or periods of economic crisis.
  • The correlation risk premium over the entire sample period averages -14.3% per month, but declines over time (see the chart below). The bulk of the option-implied variance risk premium apparently derives from correlation risk.
  • Because they seek to exploit correlation to dampen aggregate return volatility, hedge funds generally impound correlation risk. Adjusting for correlation risk (after adjusting for seven other commonly used hedge fund risk factors) reduces the alpha of a broad value-weighted hedge fund index from 5.36% to 3.47%.
  • Correlation risk exposures are particularly high for Long/Short Equity, Option Trader, Merger Arbitrage and Multi-Strategy hedge funds. Adjusting for correlation risk (after adjusting for the seven other factors) reduces the alpha of a value-weighted index of these low net market exposure funds from 13.7% to 4.25%.
  • Adding a correlation risk factor to a seven-factor hedge fund return model increases the model’s ability to explain hedge fund returns from 10.5% to 17.7%.
  • Funds with large negative correlation risk exposures tend to have high returns. The tenth of hedge funds with the most negative correlation risk exposures (implicitly selling insurance against unexpected increases in correlations) have an average raw annualized return of 13.4% and a seven-factor alpha of 8.9%. However, correlation risk explains over 10% of the 13.4% return.
  • Correlation risk exposure strongly affects hedge fund return distribution tail behavior and maximum drawdown. The typical maximum drawdown for the tenth of hedge funds with the largest negative correlation risk exposures are nearly three times bigger than the typical drawdown of the tenth of funds with the largest positive correlation risk exposure.
  • Results are robust to use of alternative databases, equal weighting instead of value weighting and inclusion of liquidity factors.
The following chart, taken from the paper, shows the six-month moving average of the implied correlation (solid line) and the realized correlation (dashed line) derived from actual and modeled correlation swap quotes. The correlation risk premium (derived from realized minus implied) is persistently negative but generally declining in magnitude over time. Expanding use of strategies seeking to exploit the premium may be compressing it.

In summary, evidence indicates that hedge funds with low net market exposure may earn returns largely by assuming that correlations between assets and asset classes will behave predictably, and rogue correlation spikes may swamp these funds with extremely large drawdowns.

Lowest 10-Year Inflation Rate in Forty Years...

...at least according to the government.  In last Friday's release of the CPI, the ten-year change in consumer prices dropped to its lowest level in over forty years.  Over the last ten years the CPI has risen 25.97%.  The chart below shows the rolling ten-year change in the CPI.  Not since June 1969 has the ten-year rate of change been this low.

MID-MONTH PERFORMANCE UPDATE FOR THE MAJOR ASSET CLASSES

Misery loves company, but returns for the major asset classes show no sign of wear this month from the economic worries of late. If anything, the chatter about deflation and the potential for a double-dip recession has emboldened the bulls in July. Save for TIPS, prices are higher across the board, and by more than trivial amounts for most broadly defined asset classes

Indeed, it's been a strong month for gains through July 19. There's no assurance that the advances will hold up through the end of the month, when we publish our strategic monthly recap (the last one was published here). In fact, there's a good case for expecting a tactical retreat, or at least a downshift in the buying. Meantime, the year-to-date tallies look impressive. Perhaps it's fair to say that the crowd has been willing and able to climb a wall of worry.
072010a.GIF
Foreign stocks are the big winners so far in July--equity markets in developed market nations in particular. Vanguard Europe Pacific ETF (VEA) closed yesterday with a gain of more than 7% for the month so far, the clear leader among our ETF proxies for the major asset classes. The rest of the world's stock markets aren't doing so bad either. In the U.S., equities have climbed nearly 4%, based on Vanguard Total Stock Market ETF (VTI).

Overall, July has been a powerful month for returns, as shown by the 3.9% price gain so far in July for the Global Market Index, a passive mix of all the major asset classes weighted by market value. As returns for this benchmark go, that's an impressive run over such a short period. The pace won't last, of course. But for the time being, there's a strong tailwind blowing all the major betas higher.
The issue is one of deciding whether a) the markets correctly sense a better-than-expected future in the months ahead; or b) the speculators have gone off the deep end in recent weeks. It's clear why bond prices might run higher. If investors are worried about economic weakness and deflation, rushing into the safe haven of fixed income has obvious appeal. But why the simultaneous surge in demand for risky assets in recent weeks? Is the economic future a good deal brighter than it appears? Or have the optimists run ahead of reality once again?

Are Top-Line Worries Overblown?

The recent commentary coming out of talking heads has been that weak top-line numbers this earnings season have been a main culprit for the declines we've seen since the reporting period began last Monday.  The actual numbers dispute this argument.  So far this earnings season, 73% of companies have beaten their top-line revenue estimates.  As shown below, 73% is at the high end of the range seen during quarterly earnings seasons going back to 1999.  The average revenue beat rate since then has been 62%.

Maybe recency bias is involved.  On top of the argument that revenue numbers have been weak for the entire market, many of the guests on the various business channels today are arguing that revenue numbers in the technology sector have been really bad.  Sure, revenue numbers did come in weaker than expected for the two major tech companies that reported yesterday after the close (TXN & IBM), but prior to that, not one tech company had missed revenue estimates this earnings season!  As shown below, thirteen tech companies have beaten revenue estimates this season, while three have missed.  When Intel reported blowout numbers last week, all was good in the world.  Now all is bad in the world.  As mentioned earlier, the revenue beat rate is currently at 73% -- 11 percentage points above the historical average.  If it declines to the historical average over the next couple of weeks, then there is cause for concern.  But for now, one day of bad numbers does not make an earnings season trend, so don't buy into the top-line worries just yet.

Monday, July 19, 2010

Time horizons and market correlations

Given our interest in the potential for a “forthcoming golden age of stock picking” we wanted to highlight a couple of posts that highlight the current state of the markets.  At least on the country selection front there is a ray of hope for active managers.

Bill Hester at Hussman Funds* notes how in the global equity markets there is a growing spread in country returns.  Thereby making country picking strategies potentially more lucrative. He writes:
More recently through 2007 the divergence in stock market returns among developed countries collapsed. There was very little value in making distinctions at the country level when individual country returns were so tightly centered about broad benchmark return levels.  These trends have shifted the last couple of years and the recent spread between relative performances continues to widen.
He notes that some of this divergence has to do with the relative concentration of the banking sector on index returns.  The guys at Systematic Relative Strength chime in thusly:
The greater the dispersion in returns, the more likely relative strength is to be able to deliver superior performance over a benchmark index fund. If we do indeed see much greater divergence in country returns going forward, relative strength is well-positioned to capitalize.
The general point being that as relative economic performance diverges across the world we should expect to see some continued divergence in country returns.  Relative strength being one method to take advantage.
On the domestic front, there is little in the way of divergence.  Today Zero Hedge highlights some research showing a continued increase in cross-equity correlations.  In short, stocks are moving more and more alike these days. They quote Matt Rothman of Barclays:
To belabor the obvious and put this in perspective, current levels of correlation are higher than in October 1987, anytime during the Fall of 2008, either the run-up or the bursting of the Internet Bubble, or after 9/11. The reason this matters to all stock pickers — fundamental or quantitative — is because with stock return dispersions at all-time lows, it is extraordinarily difficult to be picking stocks.
One can argue whether that has do more with the macroeconomic situation or the rise of high-frequency trading.  We would add increasing interest in sector ETFs as another contributing factor, as well.  One would think that at some point this trend will reverse.
This could come through an adverse market event, as ZH surmises, or from the renewal of a bull market.  In either case, stock selection would once again come to the fore.  Individuals can’t trade like high frequency traders or proprietary trading desks. By necessity individuals need to have a longer time horizon than these market players.  Therein lies the opportunity for dedicated investors.

Highest Single Stock Correlation with S&P500 Since ‘87 : Is Alpha becoming Beta?

Is Alpha becoming Beta?


That seems to be the case lately, with a very high correlation between stocks.The WSJ noted the sync between individual names in Component Stocks’ Correlation to S&P 500 at Highest Level Since ‘87 Crash.
Hence, it is not really a “stock pickers market,” as so many know-nothing pundits are trying to tell you.
Jim Bianco blames “Macro Investing” — between ETFs, program trading, and other factors, this leads to increasing degrees of correlation.

I think its more of a sign of indecision, and traders sitting on their hands.

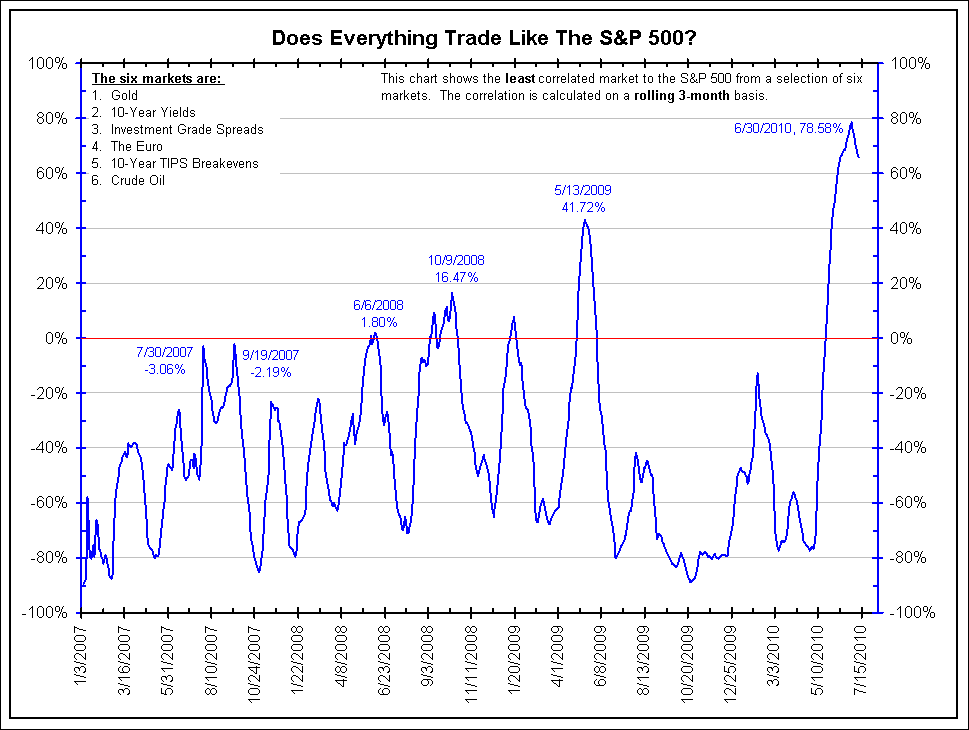
Here is Jim’s chart, showing the correlation between 6 other markets that are trading like SPX:
>
click for bigger chart

chart courtesy of Bianco Research

Wednesday, July 07, 2010

Alpha Is Dead: Barclays Says With Stock Dispersion At All Time Lows, It Is "Not A Stock Pickers' Market"


There is a simple reason why all hedge funds with "relative value" or "deep value" in their names will soon be looking to change their moniker: stock picking no longer works, with the only strategy that matters, as implied correlation is now at the second highest level in history, is picking the time to leverage beta exposure and riding the broader market up or down. Alpha is now dead. as Barclay's head of quantitative strategies Matt Rothman says, "Indeed, it was hard to be a stock picker in the market for the last two months as the last two months have seen historically low levels of dispersion in stock returns. As shown in Figure 2, the cross-sectional correlation across all stocks in the market was at its second highest level last month (measured back to July 1950) and recorded its third highest level this month; there have never been to two months back-to-back with anything approaching these levels. To belabor the obvious and put this in perspective, current levels of correlation are higher than in October 1987, anytime during the Fall of 2008, either therun-up or the bursting of the Internet Bubble, or after 9/11. The reason this matters to all stock pickers — fundamental or quantitative — is because with stock return dispersions at all-time lows, it is extraordinarily difficult to be picking stocks." In other words, the danger of yet another systemic meltdown (or up), now that everyone is on the same side of the trade (and whoever isn't, is getting steamrolled), is higher than ever in history, up to and including May 6. And he, who has the greatest access to (risk free) leverage wins. Therefore look for all the "investment bank" hedge funds with prop desks and discount window access to once again post record trading days for the current and all future quarters until even they blow themselves up eventually and the Fed can do nothing to prevent it.
Full market commentary from Matt Rothman:
For us, this month was not so different from last month. Our models continued to work, marking two straight months of solid out-performance, ending our long spirit-crushing dry spell of underperformance. The broad market averages maintained their downward trajectory as investors continue to worry about the engines for future growth with implications from currency markets and various fixed income markets all leaking into the equities market. And so once again, it turned out to be all about quality.

This was good news for our portfolios – and for most practioners of quantitative stock picking – since our quantitative models give us positive exposure to the styles of investing that the market has been rewarding recently. Our models are built to gain consistent exposure to cheap high-quality companies with positive sentiment. In general, we like companies that are attractive on an earnings yield or free-cash-flow basis with strong historical profitability, improving margins and repeatable earnings that are also are being acknowledged by the market as having room to run through strong price momentum and improving earnings forecasts. Now, of course, it is high unlikely for any one company to have all of these characteristics going in their favor at any one moment in time, so our model is a way of picking and choosing stocks that come the closest to having it all. Moreover, not all of the characteristics described above are all positively rewarded by the market at any specific time.

What is noteworthy is that in recent months all three basic investment styles have all been working well. Cheap companies are outperforming expensive companies. High Quality companies are outperforming Low Quality companies. And companies with positive Market Sentiment have been outperforming companies with poor Market Sentiment. This lead to the relatively strong performance by our Quantitative models. In our long-only portfolio, 62.4% of our stocks beat their Russell 1000 benchmark. In the long-short portfolio, 66.8% of the longs beat the Russell 1000 and 47.2% of the shorts trailed the Russell 1000, for a combined stock selection hit rate of 57.1%. Last month, stock selection was strong for our model because the styles we liked were rewarded.

Let’s be clear, though, that this is not the same thing as saying this was a “stock picker’s market”. Indeed, it was hard to be a stock picker in the market for the last two months as the last two months have seen historically low levels of dispersion in stock returns. As shown in Figure 2, the cross-sectional correlation across all stocks in the market was at its second highest level last month (measured back to July 1950) and recorded its third highest level this month; there have never been to two months back-to-back with anything approaching these levels.1 To belabor the obvious and put this in perspective, current levels of correlation are higher than in October 1987, anytime during the Fall of 2008, either the run-up or the bursting of the Internet Bubble, or after 9/11. This observation holds across sectors, with the correlation of stocks within Materials, Industrials, Consumer Discretionary, Consumer Staples, Health Care, Financials, Technology and Utilities sectors all being at or very near historical highs.

The reason this matters to all stock pickers — fundamental or quantitative — is because with stock return dispersions at all-time lows, it is extraordinarily difficult to be picking stocks. The decisions that matters are related to style selection not stock selection. We are fortunate because the styles favored by our Quantitative model (Quality, Value and Sentiment) are being favored by the market. Clearly, the current levels of cross-sectional correlation are unlikely to be sustained and we fully expect to see them revert to their more normal levels in relatively short-order (weeks to months). Just as cross-sectional stock correlations converge towards 1 as markets falter, they tend to dissipate as markets rally. But we believe it would be unwise to read the chart above as a reason to think that a market rebound is due in immediate future. For example, market cross-sectional correlations remained highly elevated throughout the Fall of 2008 and first three months of 2009 (at levels above 50%) and came all the way in as the markets rallied. But we certainly do not believe that what sent the market rallying on March 9th, 2009 was not the unsustainable level of cross-sectional stock correlations. Rather, we hold it was a combination of wise and coordinated monetary and fiscal policies by governments and central bankers across the globe. Hence, we believe this is an interesting contemporaneous indicator about the current state of the market but it is ill-suited as a leading indicator of where the market is headed.

High Yield Spreads

High-yield bond spreads are used by many investors and economists to gauge the health of markets and the economy.  During the financial crisis, the spread (the difference between junk-bond yields and comparable Treasuries) widened out to more than 2000 basis points based on BOA/ML numbers, which meant high-yield bonds had yields more than 20 percentage points higher than Treasuries!  During the 2009/early 2010 recovery, spreads came in just as fast as they spiked, and at least for now, spreads have actually remained fairly stable even as global equity markets fret about double-dip possibilities.  Spreads are currently where they were back in June of 2008.

Gold and the Dollar Moving Together?

No, your charts aren't playing tricks on you.  Over the last couple of weeks, both gold and the dollar have struggled, and prior to that, both were in uptrends.  The dollar and gold are supposed to move in opposite directions, right?  Not recently.  Below is a chart of the 50-day rolling correlation (using daily % change) between the metal and the currency going back to 1975.  As shown, there has just been a big spike in correlation that is very rarely seen.  The 50-day correlation, which is currently at 0.33, has only been above the 0.30 level 1.2% of the time since 1975.  Other spikes above 0.30 came in May 1982, March 1991, November 1992, January 1994, April 1996, and April 2002.  The last spike happened in March 2009, but the high then only reached 0.24.

Monday, June 14, 2010

Klarman Tops Griffin as Investors Hunt for ‘Margin of Safety’

By Charles Stein
June 11 (Bloomberg) -- Seth Klarman almost doubled his hedge fund’s assets to $22 billion in the past two years as the industry shrank by sticking with the off-the-beaten-path investments he’s pursued since starting out in 1983.
Unlike John Paulson, who made $15 billion by betting against home mortgages, Klarman didn’t see one big trade that would profit as markets began to collapse. The founder of Baupost Group LLC focused on corporate bonds he calculated would yield solid returns even if the economy got worse.
“We didn’t have the degree of conviction Paulson had,” said Klarman, whose views are so closely watched by investors that his out-of-print book, “The Margin of Safety,” is offered on Amazon.com for more than $1,700. “We don’t deal in absolutes. We deal in probabilities,” he said in an interview at his Boston office.
While Klarman didn’t post the gains that made Paulson famous, he was able to raise almost $4 billion in 2008 when firms including D.B. Zwirn & Co. and Peloton Partners LLP liquidated funds. Baupost was the ninth-largest hedge-fund firm as of Jan. 1, according to AR magazine, Pensions & Investments magazine and data compiled by Bloomberg. He oversees more money than better-known managers such as Ken Griffin and Steven Cohen.
A value investor who looks for securities he considers underpriced, Klarman, 53, said he’s best at “complicated” situations where fewer investors compete for assets. Over the years, Baupost has invested in Parisian office buildings, Russian oil companies and real estate that the U.S. government disposed of following the savings and loan crisis of the early 1990s, said Thomas Russo, a partner in the Lancaster, Pennsylvania-based investment firm of Gardner Russo and Gardner.
‘Complex Assets’
“He specializes in illiquid, complex assets,” said Russo, who has known Klarman since 1984.
Baupost gained an average of 17 percent annually in the 10 years ended in December, a period in which the Standard & Poor’s 500 Index fell 1 percent a year. The hedge fund has returned 19 percent a year since it was started, even as it held more than 40 percent of its assets in cash at times.
In February 2008, when Baupost accepted new investors after being closed for eight years, Klarman bought distressed corporate and mortgage debt. The fund lost 12 percent that year, its second annual decline since inception, because it bought some of the debt too early, Klarman said. It returned 23 percent in 2009 and was up 4.4 percent through April.
“It was a wonderful time to put money to work,” said Klarman.
Hedge funds on average lost 19 percent in 2008, gained 20 percent in 2009 and were up 3.6 percent through April, according to data from Chicago-based Hedge Fund Research Inc.
JPMorgan, CIT
Among the money-making bonds Baupost purchased, according to an October 2008 shareholder letter, was debt issued by Washington Mutual Inc., whose bank unit failed in 2008 and was bought by New York-based JPMorgan Chase & Co. Baupost also acquired bonds of CIT Group Inc., a New York-based lender that emerged from bankruptcy in 2009. The fund was part of a group of creditors that made a $3 billion loan to CIT in July 2009.
Klarman, in a May 18 talk to financial advisers in Boston, cited another Baupost purchase during the crisis to illustrate the way he thinks about investing. In a series of “what if” exercises, the firm calculated how much bonds of Ford Motor Credit Co. would be worth under different scenarios, including an economic depression in which loan defaults rose eightfold. The conclusion: the bonds, then selling for about 40 cents on a dollar, would still be worth 60 cents.
Real Estate
Ford Credit had net income of $1.3 billion in 2009, compared with a $1.5 billion loss in 2008. Some of its bonds have more than doubled in price since reaching lows in March 2009, Bloomberg data show.
More recently, the fund has been looking to buy privately held commercial real estate. While the fundamentals for much of that property are “terrible,” Klarman said, such investments may pay off for those willing to wait long enough.
Prices of publicly traded real estate securities have run up too far, he said in the interview. If the firm can’t come up with enough opportunities, it may return cash to investors, Klarman said.
“At this point, the clients don’t seem to want their money back,” he added. Baupost, whose investors are wealthy individuals and institutions such as Harvard University’s endowment, currently has about 30 percent of its assets in cash.
Graham and Dodd
Klarman is a disciple of Benjamin Graham and David Dodd, whose 1934 book, “Security Analysis,” is considered the bible for value investors. Graham taught finance at New York’s Columbia University where Berkshire Hathaway Inc. Chairman Warren Buffett was his student.
Klarman wrote the preface to the sixth edition of “Security Analysis,” which was published in 2008. His own book, subtitled ‘Risk-Averse Value Investing Strategies for the Thoughtful Investor,” has become a collector’s item.
Chris Ely, portfolio manager at Nichols Asset Management LLC in Boston, tried to get the book through his suburban library system. He was the 18th person on the waiting list and after six months still hadn’t gotten a copy, he said in a telephone interview.
“Seth writes about investing better than anyone ever has, bar none,” Michael Price, the longtime value investor, said in a telephone interview. Price, who sold his former firm, Heine Securities Corp., to Franklin Resources Inc. of San Mateo, California, in 1996 for more than $600 million, is now managing partner of New York-based MFP Investors LLC.
Red Sox Partner
Klarman, who was born in New York and grew up in Baltimore, worked for Price before and after graduating in 1979 from Cornell University in Ithaca, New York. He later earned a master of business administration at Harvard Business School in Boston.
Klarman is a limited partner of Major League Baseball’s Boston Red Sox, whose principal owner is commodities fund trader John Henry. He is chairman of the board of Facing History and Ourselves, a nonprofit that encourages the study of racism and anti-Semitism in schools.
As early as January 2006, Klarman warned in a letter to shareholders about “tremendous leverage,” “untested” products such as credit derivatives, low interest rates and “a housing bubble that is starting to burst.”
‘Perennially Bearish’
Today, Klarman says he worries that the dollar could lose value and interest rates and inflation may rise. Stocks will probably provide poor returns for the next 10 years, he said.
“We are perennially on the bearish side of things,” he said in the interview.
Baupost held $1.7 billion of U.S. listed stocks at the end of March, according to its latest filing with the Securities and Exchange Commission.
“We are not against owning stocks,” Klarman said in the interview. The problem, he said, is that except for a brief time in March 2009, “stocks haven’t been at bargain prices for most of the last two decades.” U.S. stocks reached a 12-year low in March 2009.
Klarman’s views on the U.S. stock market echo those of Jeremy Grantham, chief investment strategist at Boston-based Grantham Mayo Van Otterloo & Co., who recommended investors buy stocks in March 2009 after more than a decade of saying they were overvalued. Grantham’s latest forecast, posted on the firm’s website, predicted U.S. large cap stocks would return 0.3 percent a year, adjusted for inflation, over the next seven years.
Klarman called Grantham “a very smart person” whose forecasts he watches carefully. In an e-mail, Grantham called Klarman “just about the smartest guy around.”
Credit-Default Swaps
Klarman buys put options and credit-default swaps, which he calls “cheap insurance,” to protect Baupost against risks such as a steep fall in the stock market or a surge in inflation. He currently has a put, or an option to sell a set amount of a security by a specific date, that will pay off only if interest rates go dramatically higher, he said in his Boston speech. In an October 2008 letter to shareholders the firm said it benefited from credit-default swaps, without saying what the swaps were meant to protect against.
When Klarman can’t find investments he likes, he holds cash. “We prefer the risk of lost opportunity to that of lost capital,” he wrote in his 2004 yearend letter to shareholders. In 2007, Baupost gained more than 50 percent, even as it held more than 40 percent of its assets in cash.
Bruce Berkowitz, named Morningstar Inc.’s domestic stock manager of the decade and a contributor to the latest edition of the Graham and Dodd book, said Klarman stands out among fund managers because he’s able to make money while holding cash and avoiding leverage.
“If he isn’t Elvis, he’s pretty close,” Berkowitz said.

Jeffrey Gundlach’s Milkshake, Sex And Drug Paraphernalia Bring All The Investors To The Yard

 
Suck it, TCW. No, really. Do it.

Congratulations are in order for Jeff Gundlach and the DoubleLine Team! In addition to being ranked number one globally in asses (on tape), the new firm has gathered the most assets among 2010 fund launches. Naturally this calls for a celebration and a screening of Ass Traffic Volume 2 at the office would probably be most fitting, if anyone has a copy lying around.
Jeff Gundlach’s new fund is the most successful mutual fund launch of the year, but it is not the only success. Numbers just out from Morningstar show that Pimco, AQR and Fairholme are also pulling in assets with new mutual funds. The data was released by Morningstar in its May U.S. Mutual Fund and ETF Asset Flows report. Of the 80 non-target date funds launched so far in 2010, DoubleLine Total Return has pulled in $610 million since its early April launch. That puts DoubleLine’s fund more than $100 million ahead of the No. 2 new fund — Pimco EqS Pathfinder, an equity fund which pulled in roughly $500 million over a similar time span. The Pimco fund is PM’d by a pair of former investment professionals who jumped from Franklin Resources’ Mutual Series family.

The news must be especially sweet to Gundlach, who founded DoubleLine after leaving TCW last December. At TCW, he was the PM for TCW Total Return, a rival fund to Pimco’s flagship Total Return fund PM’d by Bill Gross.

Monday, June 07, 2010

Biggest Equity Outflow In Recent History Leads To Fifth Consecutive Outflow From High Yield Funds


Last week was the fifth consecutive week of HY mutual fund outflows, which while smaller than the prior week's $1.4 billion, was still a material $759 million. With that the five consecutive weeks of HY outflows now stand at $4.3 billion, which is the second largest 5 week sequential outflow from HY funds in history, only better compared to the $4.9 billion in August of 2003. With the disappointing end of week performance in stocks last week, we anticipate that next week Lipper/AMG will announce another huge outflow. With this week's HY outflow, YTD flows are now just barely positive at $898 million. Yet the HY action was nothing compared to the unprecedented, if not record, outflow in domestic equities: ICI reports that the week ended May 26 had $13.4 billion in domestic equity outflows: a number the likes of which we don't recall even in the post-Lehman days.

Curiously, even as flows out of all risky assets picked up, money market saw yet another outflow of $11.5 billion, bringing total YTD money market outflows to $414 billion, or -12.9% of total money market assets. Ironically, the only asset class (aside from gold) outperforming this year is the dollar. Instead of keeping capital invested in cash, Americans have shifted nearly half a trillion out of the best performing asset in 2010.
Yet what is once again odd, is that the differential between YTD Money Market outflows and all other risky asset inflows, is now a 2010 high $120 billion. For all those who wonder where the money to buy 2 million iPads immediately after launch comes from, here is your answer. Americans are moving capital away from what they deem (incorrectly) is an unsafe asset class, and instead of putting it into riskier assets, they are spending it. One can only wonder what happens to already weakening retail sales, once the temptation to reallocate capital back to money markets rears its ugly head.

Wednesday, June 02, 2010

Looking at the May Swoon


The stock market just finished its worst May since 1940. As it turns out, watching France fall to the Nazis isn't good for stocks here. Also, watching the euro fall to reality is pretty nasty as well.
Let's take a closer look at where the market stands today. Here's the S&P 500 (black line, left scale) along with its earnings (gold line, right scale).

image947.png

I've scaled the two lines at a ratio of 16 to 1 so whenever the lines cross, the market's P/E Ratio is exactly 16.
Let me add that looking at the market's P/E Ratio is far from perfect (the future earnings line is, of course, merely forecast), but nevertheless we can gain some insights as to what investors are thinking at the moment.
Two items stand out. The first is that the S&P 500 has fallen below a P/E Ratio of 16 which has generally been its lower bound over the past few years. The second is that the earnings forecast is still very favorable. If stocks keep pace with valuations, then the S&P 500 could easily be over 1400 within 18 months.

This is where the problems come in. It appears that investors are beginning to question the robustness of the recovery. Given the amount of aid needed, that's certainly understandable. So if the earnings forecast turns out to be overly optimistic, then the whole bullish scenario falls apart.

WHITNEY TILSON: THIS IS NOT 2008

Whitney Tilson’s T2 Partners continues to outperform the market despite the recent volatility.  T2 was down just 2.8% in May while the S&P 500 declined 8%.  Tilson has been particularly prescient over this market cycle and was a notable real estate bear heading into the credit crisis.  Despite the recent market disruption Tilson is not concerned that we are repeating 2008.  In his May letter to clients Tilson detailed his market outlook:
“So if last month was analogous to late 2007, is the situation today like early 2008 (in which case, we should still be battening down the hatches)?  We don’t know for sure, but probably not.  We think the most likely scenario is more years of the choppy, range-bound market that we’ve been in for more than a decade – and that’s fine with us, as it rewards good bottoms-up stock picking, which is our forte.”
Tilson has been buying the weakness and using the opportunity to purchase more of some of his favorite positions:
“During the month, we did what we normally do when the market has violent swings: the precise opposite of the herd.  On weakness, we initiated a few new long positions, added to some existing holdings like General Growth Properties, and trimmed certain shorts like Simon Properties Group, which we owned primarily as an industry hedge against GGP and felt was no longer necessary with GGP falling into the $12 range. “
Tilson’s fund isn’t positioned for sunny skies, however.  He continues to maintain a substantial short book and feels extremely confident in the continued outlook for hedging strategies over the coming years:
“As you might expect, our long book dropped significantly (though not as much as the market), while our shorts offset much of these losses.  Losers of note on the long side were Liberty Acquisition Corp. warrants (-52.2%), Resource America (-33.7%), Borders Group (which we have mostly exited) (-22.4%), American Express (-13.6%), General Growth Properties (-10.7%) and Berkshire Hathaway (-8.2%).  In the plus column were Iridium, with the stock up 12.4% and the warrants up 21.9%, and EchoStar, up 9.5%.
On the short side, our largest position, InterOil, tumbled 26.5% (in addition, the puts we own jumped 70.2%), MBIA fell 22.2%, DineEquity dropped 17.9%, and the homebuilder ETF (ITB) declined 11.5%. “

Lunch is for wimps

Lunch is for wimps
It's not a question of enough, pal. It's a zero sum game, somebody wins, somebody loses. Money itself isn't lost or made, it's simply transferred from one perception to another.