Monday, September 28, 2015

Chart-tacular


Bridgewater on Risk Parity (September Update)

https://www.bwater.com/Uploads/FileManager/research/Our%20Thoughts%20about%20Risk%20Parity%20and%20All%20Weather.pdf

Emerging Markets Sentiment Summed Up...

The number of money managers with “underweight” positions in emerging markets touched a 10-year high, according to September’s monthly survey of fund managers from Bank of America Merrill Lynch. “It is too early to call a bottom in emerging markets, but valuations now appear attractive,” says Ursula Marchioni, chief strategist at BlackRock’s iShares ETF division.

Thursday, September 10, 2015

DB: Developed Markets Stocks & Bonds Have Never Been This Universally Expensive

Thanks to the new normal world of extremely loose monetary policy and extraordinary accumulations of financial assets by Central Banks, Deutsche Bank finds that we live in a period not of selectively expensive global asset prices, but of record "expensiveness" across developed market bonds, stocks, and real estate.
 
In aggregate, across the three main asset classes, average valuations are close to the highest they’ve ever been relative to their long-term trend. The current reading of just under 80% is similar to that seen at the turn of the twentieth century and during the 1940s when financial markets were artificially repressed around war time.
And, based on Deutsche's valuation metrics, bonds and equities alone are at their highest ever combined valuations when aggregated across these 15 countries.

In addition, 83% of observations are in their top 20% of valuations through history.

Peak Asset Prices?
Source: Deutsche Bank

It's OK - Janet will know what to do


Shhhh.... Don't tell anyone: Copper has quietly rallied 9% off the lows


Various Graphics / Charts / Comments


Friday, September 04, 2015

Leon Cooperman Blames Risk Parity For Market Chaos

Last week JPMorgan Chase & Co. (NYSE:JPM) Chase & Co. warned its clients that Volatility Target strategies, CTAs and Risk Parity portfolios could sell a combined total of $150 billion to $300 billion of equities during the next few weeks as momentum drives selling (Concerns Over Risk Parity Grow [Cont.])


The report from JPMorgan came a few days after the Financial Times published an article on the risks that Risk Parity strategies posed to the global bond market. The Financial Times cited a new report from AllianceBernstein (Introduction to Tail Risk Parity an old copy of the paper can be found here), which estimates that risk parity is now a $400 billion industry. Assuming an average leverage ratio of 355%, these funds control around $1.4 trillion in assets.
Risk-parity
Risk Parity strategy

Leon Cooperman on risk parity

Reports from the Financial Times, AllianceBernstein and JPMorgan all imply that Risk Parity is a disaster waiting to happen. And Leon Cooperman, the founder of Omega Advisors just joined the party.
Within his August letter to investors, Cooperman blamed Omega's poor returns (year to date Omega's funds are down between 6% and 11% according to Omega's letter to investors reviewed by ValueWalk) on "price-insensitive" investors.
Our investment process, grounded in fundamental company research, with a capital marketr overview designed to help us gauge appropriate risk asset exposure, has served us well since our inception 23 years ago, and we believe in its continued effectiveness. The firm has virtually no debit balance, and we like what we own.
With respect to the investment outlook, we believe that shares in the U.S. will end the year higher. A slowing in China's economic growth, the surprise devaluation of the yuan in August, continued weak oil and commodity prices, and uncertainty as to the timing of the first Federal Reserve rate hike, all contributed to an initial weakness in U.S. and global equity markets in late August. However, these factors, we believe, cannot fully explain the maenitude and velocity of the decline in equity markets last month. We think that much of that decline can Ix attributed to systematic/technical investors that are price-insensitive and largely indifferent to fundamentals. Such investors include risk-parity funds, derivative hedgers, trend-following CTA's, and insurance variable-annuity programs.
The month of August was a bad one for global risk markets and a bad one for Omega. The S&P 500 dropped 6%, its worst monthly decline in over three years. Our various investment funds, excluding our Credit Opportunity Fund which eased just 1.4% last month, declined by between 9% and 11% in August. Year to date, our equity-focused funds are down between 6% and 11%; differential returns among our funds reflect different investment mandates. The Credit Opportunity Fund has a total return of 9% year-to-date.
We are very disappointed in our performance. Prior to the August decline in U.S share prices, we were of the view that our equity market was in a zone of fair to full value and had moderate upside potential to year-end. The swift and severe correction in U.S. and global equity markets took us by surprise, as our analysis of the fundamentals did not signal noteworthy equity-marks vulnerability. Be assured that everyone at Omega is committed to reversing our 2015 year-to-date experience. Our investment process, grounded in fundamental company research, with a capital marketr overview designed to help us gauge appropriate risk asset exposure, has served us well since our inception 23 years ago, and we believe in its continued effectiveness. The firm has virtually no debit balance, and we like what we own.
With respect to the investment outlook, we believe that shares in the U.S. will end the year higher. A slowing in China's economic growth, the surprise aevaluation of the yuan in August, continued weak oil and commodity prices, and uncertainty as to the timing of the first Federal Reserve rate hike, all contributed to an initial weakness in U.S. and global equity markets in late August. However, these factors, we believe, cannot fully explain the magnitude and velocity of the decline in equity markets last month. We think that much of that decline can 3e attributed to systematic/technical investors that are price-insensitive and largely indifferent to fundamentals. Such investors include risk-parity funds, derivative hedgers, trend-following CTA's, and insurance variable-annuity programs.
While it is obviously difficult to estimate when these systematic/technical investors will stop roiling the markets, we do believe that the conditions for a further sustained decline in share prices are not in-place and that shares should trend higher over the coming year. Put simply, the end of an equity bull market has almost always required the following: significant acceleration in wage and consumer price inflation; tight monetary policy as represented by declining year-over-year growth in real money supply; the expectation of recession; investor exuberance; speculative aggregate market valuation; and net purchases of equities by individuals. None of these precursors to a bear market are evident today nor do we expect their arrival any time soon. Further, the large percentage of stocks in the S&P 500 down year-to-date, and the significant percentage of stocks down in excess of 15% year-to-date, both signal that substantial damage to shares has already been incurred. Based on these observations, if the U.S. equity bull market is over, it will be the oddest ending to a bull market in the post-war period.

RBC: Selling slows

While Leon Cooperman and others are blaming Risk Parity strategies for the market panic caused at the end of last month, in a note to clients this week RBC Capital reported that there's been a sizeable slowdown in the exposure cutting of leveraged trading strategies this week.
RBC's traders have reported a "strong bid into the back part of the SPX cash session 4 of the past 5 days." However, according to the note to clients, the bank reports that a number of different buy-side sources have estimated anywhere from $75 billion to $100 billion apiece of S&P futures selling from leveraged vol target / risk-parity / systematic quant strategies over the past 10 days -- an estimated $275 billion of futures supply against estimates from some around $300 billion of exposure cutting to do.

Monday, August 31, 2015

Wednesday, August 26, 2015

Charts, with comment. (Buy fear)

Market has demonstrated MORE fear in this move than Lehman?!?


Yes, this is a major correction. Now you have the numbers.


Bear in mind the marginal buyer/seller. Feels like ETFs/Passive (indiscriminate) are playing a large role.


For all the talk about slowing Chinese GDP and the stock market, it doesn't seem that they're all that connected. Convenient narrative?


Long Bond Outperforming...for a while now


Sentiment went from Bullish to Very Bearish --- Real Fast


In case anyone asks, What happened in China?


David Einhorn's Holdings - this month performance. Ugh.


Eurozone Credit Leading Equities Higher, ahead of Draghi in Jackson Hole


Spreads....


Bear Market Checklist


China is a big player in commodities, but not the only consumer


Manager Style and Outperformance (Illusion thereof)

Figure 1: Morningstar Style Box Performance and Percentage of Managers that Outperformed. Three years ending June 30, 2015.
Source: Morningstar magazine, August/September 2015, chart and regression by R. Ferri
Figure 1 graphically illustrates the relationship between style performance and the ability of active fund managers to outperform the style. Mid-cap Value (MV) earned 20.7% annually and outperformed all other styles; MV managers had a very difficult time outperforming this index and succeeded only about 9% of the time. In contrast, Large-cap Value (LV) earned 14.1% annually and was the worst-performing style index; LV managers had an easier time outperforming, winning about 63% of the time.
The regression is close to 85%. This means the percentage of managers who outperformed in each style is highly correlated with the relative performance of the style index. The greater a style index outperforms adjacent styles, the fewer managers outperformed in that style and vice versa.
This observation isn’t new in mutual fund analysis.  William Bernstein wrote about the phenomenon in 2001 article, Dunn’s Law Review: The Life and Times of “Core and Explore,” in which he noted, “[T]he fortunes of indexing a particular asset class depend on its performance relative to other asset classes.”
The concept was expanded by William Thatcher in a 2009 article, When Indexing Works and When It Doesn’t in U.S. Equities: The Purity Hypothesis. Both articles indicate an inverse relationship between a style’s relative performance to other styles and active management’s ability to outperform in style.
This brings us to a couple of important questions. First, when do a majority of active managers outperform a poor-performing style? Second, can managers time styles and position their portfolios accordingly and make it worth investing in messy active funds?
Tables 1, 2 and 3 help answer the first question: When do a majority of active managers outperform a poor performing style? The yellow box with the red numbers in each table represents the percentage of managers that outperformed that style over a three-year period ending in June 2015. The red box represents the performance of the Morningstar style index for that category. The green box represents the performance of surrounding Morningstar style indices.


Table 1 indicates Large Cap Value (LV) managers had a great run over the three-year period ending June 2015. Almost 63% of active manager beat the Morningstar Large Value Index return of 14.1%. It’s easy to see why. The green areas in Table 1 represent the performance of adjacent styles indices: Large Core (18.3%), Mid Core (19.9%), and Mid Value (20.7%). All three had notably superior performance to Large Value. Any messy LV managers who invested outside of, but near the LV style index constituents would have added performance to their portfolio.
Table 2 shows the opposite story for Mid Cap Value (MV) managers. Only 9.0% outperformed their style index. MV was the highest-performing style of the nine style boxes, so any messiness on the part of MV managers would have hurt their performance relative to the style index – and it did.
Table 3 represents Small Cap Value (SV) managers, 33.6% of whom outperformed the Small Cap style index. Although the index performed satisfactorily at 17.0%, it underperformed the adjacent style indices, but not by as wide a margin as LV in Table 1. Accordingly, there was some benefit to active SV manages, but not enough to increase their win rate over 33.6%.
This latest evidence substantiates what Bernstein and Thatcher have indicated in the past: It appears there is no truth to the cliché that the market is inefficient in one style and not another. It’s about style performance relative to adjacent styles, and how messy managers are about remaining within a style in their equity selection.
Active fund managers look superior when their benchmark style performs poorly relative to adjacent styles, and they look bad when their benchmark style outperforms adjacent styles by a meaningful amount. Eventually, this all comes out in the wash. Active managers in every style have underperformed by about the same percentage. Please see The Power of Passive Investingfor more analysis on this topic.
The second question is easier to answer: Can active managers time styles and position their portfolios accordingly? They cannot. If they could, today’s Morningstar active versus passive results would show improvement since the time Bernstein wrote about it. But it has not. Managers do not appear to have persistent skill in timing investment styles.
Mutual fund rating services help investors compare the performance of one style to another by creating style indices, and they help investors compare the performance of funds within a particular style. But raw data can create the illusion of superior performance when none exists. You’ll need to dig deeper into a manager’s performance to determine if he or she truly has ongoing skill or if it’s just an illusion.

Monday, August 24, 2015

US asset manager warns over ‘risk parity’


AllianceBernstein, a big US asset manager, has warned that the swelling popularity of an investment strategy known as “risk parity” is exacerbating the fragility of financial markets and worsening sell-offs. 
Equity and bond markets have been hit hard by fears over sliding commodity prices, China’s economic slowdown and the resulting emerging market struggles this month, heightening concerns of hidden faultlines in markets caused by certain strategies.
So-called risk parity is a next-generation passive strategy — originally pioneered by Bridgewater, the world’s biggest hedge fund group — that seeks to give equity-like returns, while providing the relative stability of bonds in a crisis.
Risk parity funds typically invest in a basket of stocks, bonds and commodities, but “leverage” the traditionally safer fixed-income bets through derivatives to ensure each asset class contributes equally to a portfolio. Simplified, the theory is that when equity markets are buoyant the extra leverage will ensure that the bond portfolio does not drag on performance, and when markets are jittery the juiced-up bond positions will ameliorate a stock slide. 
The robust and consistent returns of risk parity funds in recent years has helped them swell in size and number since the financial crisis, led by hedge funds including Bridgewater and AQR. Big asset managers such as BlackRock, Invesco and AllianceBernstein itself, have also embraced the approach.
A report on bond markets by AllianceBernstein estimates that the total assets under management of RP funds could now be about $400bn, even excluding in-house RP funds in pension funds and insurers that have also embraced the strategy. With leverage that means that the RP industry now controls about $1.4tn of assets, the report estimated, not including in-house vehicles.
Douglas Peebles, head of fixed income at AllianceBernstein, compares the rise of risk parity to the invention of “portfolio insurance” in the 1980s, a tactic that was supposed to protect stock investments by using derivatives, but played a crucial part in the “Black Monday” Wall Street crash of 1987.
“It’s a core, structural change in the marketplace. Each investor is making a rational decision, but put them all together and it has caused a dramatic change in markets,” he says. “It has made the system more fragile.”
AllianceBernstein — as well as other asset managers including Pimco and GMO — point out that risk parity depends on leveraging bond investments, low volatility and modest correlations between different markets over time. 
When turbulence spikes, RP funds automatically sell assets in response, but that can intensify sell-offs. Some analysts say the strategy played a crucial role in aggravating the 2013 “taper tantrum” when investors were alarmed by the Federal Reserve preparing to end its monthly bond purchases.
“Should correlations turn positive, with stocks and bonds declining at the same time, the risk contribution of each one would rise. Managers would then have to sell both to maintain their risk targets. In other words, selling begets selling,” the AllianceBernstein report said.
Mihir Worah, one of PIMCO’s chief investment officers, is less concerned about the broader dangers but warns that it is a “case of buyer beware” for investors unappreciative of the fact that the outlook for the RP strategy is dimming.
“People think risk parity is a magic bullet, but it’s not,” he said. “It’s a fundamentally good idea, but it has benefited inordinately from falling volatility and falling bond yields. But we are now entering an environment where bond yields are probably going to rise, and volatility is going to increase.” 
Another risk parity fund manager argued that the strategy was misunderstood and overly maligned, pointing to tests that show that it performed well under almost any scenario. But he admitted: “Strategies that mitigate risks to make themselves more secure might make the overall system more dangerous.”

Before Today: As of Friday Nearly 70% Of S&P 500 Stocks In Correction Or Bear Market Territory


Last week's market pullback did not spare too many equities from the draw down. As of the close on Friday, 30.3% (152 issues) of S&P 500 stocks are now down greater than 20% from their 52-week highs and another 39.0% (196 issues) are down between 10% and 20% from their 52-week highs. In total nearly 70% of stocks are in correction or bear market territory. Below is a table noting this breakdown.

Tuesday, August 18, 2015

Some Thoughts On Emerging Markets

Emerging Markets have been performing awfully lately. And by lately, I mean the last six years in which little progress has been made. To make matters worse, there was a huge opportunity cost of having capital allocated away from U.S. equities.

spy eem
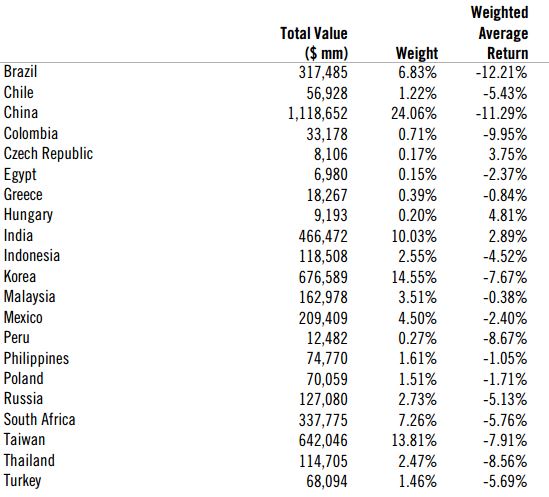
After six years of sideways movement, Emerging Markets are beginning to really move again, only in the wrong direction. Take a look at July’s performance, courtesy of Dimensional Funds. You’ll notice virtually no country was spared.
country
Neither was any size or style.
size
Or sector.
other

So what do we do now with Emerging Markets? That obviously depends on what sort of investor you are, what your holding period is and all the other usual caveats. For investors committed to a diversified portfolio, understand that you’ll never hold enough of what’s going up and you’ll always hold too much of what’s going down. For broadly diversified portfolios, dealing with a lousy investment is a feature, not a bug.

Lunch is for wimps

Lunch is for wimps
It's not a question of enough, pal. It's a zero sum game, somebody wins, somebody loses. Money itself isn't lost or made, it's simply transferred from one perception to another.