https://www.youtube.com/watch?v=qve6kCm-iig
Wednesday, February 25, 2015


Monday, February 23, 2015
This Won't End Well
With the S&P 500 now in positive territory for the year and the mainstream media back in normal cheerleading mode, it is worth noting that 1) "Most shorted" stocks have outperformed the broad market this year, 2) the last 3 weeks have seen the biggest short squeeze in almost 4 years, and 3) Hedge funds are now at a record high 57% net long. We suspect, given the looming Humphrey-Hawkins and March FOMC and the short-term 'gap' between the market and fun-durr-mentals, volatility will be on the rise again.
The "Most Shorted" stocks outperformed the broad market in 2015 so far...

Amid the biggest short squeeze since 2011...

Hedge funds have never been more net long the market...
Short positions shed light on the “other side” of fund portfolios
We combined $1.5 trillion of single-stock and ETF long holdings in 13-F filings of 854 hedge funds with our estimate of hedge fund short positions. We estimate hedge funds accounted for 85%, or $627 billion, of the $738 billion in single-stock, ETF and market index short interest positions filed with exchanges as of December 31, 2014.
We combined $1.5 trillion of single-stock and ETF long holdings in 13-F filings of 854 hedge funds with our estimate of hedge fund short positions. We estimate hedge funds accounted for 85%, or $627 billion, of the $738 billion in single-stock, ETF and market index short interest positions filed with exchanges as of December 31, 2014.

Our analysis suggests that hedge funds operate 57% net long (net/long), a new record.

And the yawning chasm between markets and macro and micro is daunting to all but the most 'ignorant'...

Wednesday, February 11, 2015
To Hedge or Not to Hedge Currency in International Stock Portfolios: Morningstar
 WisdomTree Japan Hedged Equity (DXJ). The fund owns a portfolio of dividend-paying Japanese stocks that generate more than 80% of their revenue outside of Japan. It gained nearly 42% in 2013, as a massive dose of monetary stimulus contributed to an 18% decline in the value of the Japanese yen, and steady improvement in the global economy gave Japan's stock market an additional boost. In contrast, iShares MSCI Japan ETF (EWJ), which tracks a standard market-cap-weighted benchmark and does not hedge its yen exposure, increased by 26% in 2013. Clearly, it paid for U.S. investors in Japanese stocks to have a hedge against a declining yen over this span. But was this a flash in the pan, or do currency hedges have value over longer time frames? With the U.S. dollar marching steadily higher--thanks in part to (relatively) attractive interest rates--and double-digit moves in major currencies making headlines, now is a good time for investors to explore these questions.
In simple terms, a domestic investor's local-currency-denominated return in a foreign security (or a portfolio of them) is equal to the foreign security's (or portfolio's) return plus the foreign currency return, plus the product of the foreign security return and the foreign currency return. The last part of this equation accounts for the interplay between the two, and as it is the product of these two figures, its contribution to the overall return will grow as either the foreign asset return or the foreign security return grows larger.
iShares MSCI Brazil Capped ETF (EWZ) in 2009. These examples highlight that currency effects can be extreme in magnitude.It is useful to look at historical data to frame the effects of currency hedging on investment performance (for U.S. investors in this case). There are two key elements to consider when assessing the effects of currencies on equity portfolios: their contribution to return (as covered above) and their contribution to risk.


The best answer to the question of whether it makes sense to hedge the currency exposure of an international-stock portfolio is this: It depends. By hedging foreign-currency exposure, investors can mitigate a source of risk--but at the expense of a potential source of return. The trade-off between the two is important, and investors' decisions will depend on a variety of factors, including but not limited to their return requirements, risk tolerance, investment horizon, and the costs associated with hedging currency exposure.
High Market Valuations May Signal Low Future Returns: Morningstar / GMO
American Funds New World (NEWFX) or Vanguard Emerging Markets Stock Index (VEMAX), while those who want bond exposure in developing markets will want to take a look at the likes of Fidelity New Markets Income (FNMIX) and PIMCO Emerging Markets Bond (PAEMX). BHP Billiton (BHP), Priceline (PCLN), Apache (APA), and Cabot Oil & Gas (COG). Premium Members can define their own criteria to focus on stocks with the characteristics that they most desire.GS Explanation on Oil Prices; Good Chart
Oil prices have gotten crushed for the last six months. The extent to which that was caused by an excess of supply or by a slowdown in demand has big implications for where prices will head next. People wishing for a big rebound may not want to read farther.
Goldman Sachs released an intriguing analysis on Wednesday that shows what many already suspected: The big culprit in the oil crash has been an abundance of oil flooding the market. A massive supply shock in the second half of last year accounted for most of the decline. In December and January, slowing demand contributed to the continued sell-off. Goldman was able to quantify these effects.
The Culprit Is in Blue

Goldman’s model is simple on its face, looking at just two variables over time: the price of oil and the value of U.S. stocks (as measured by the S&P 500). The idea is that the stock market is a pretty good indicator of economic demand. So when stocks move in tandem with oil prices, demand is in the driver’s seat. When the price of oil moves in the opposite direction of stocks, the shock is coming from supply.
It’s a bit more complicated than that—for the statistically inclined, Goldman uses a “vector autoregression with sign restrictions”—but you get the idea. In the following chart, they split apart the effects of demand shocks (left) from supply shocks (right).
Demand & Supply

The chart on the left shows what you might expect: strong demand leading up to a precipitous decline during the recession beginning in late 2008. The supply chart on the right shows a shock of undersupply in late 2007, leading to years of relatively steady supply expectations. Oversupply shocks picked up, beginning in 2012, as U.S. shale-oil production exceeded expectations, culminating in a piercing shock of oversupply last year that sent markets reeling.
The big take-away: “[T]he decline in oil has been driven by an oversupplied global oil market,” wrote Goldman economist Sven Jari Stehn. As a result, “the new equilibrium price of oil will likely be much lower than over the past decade.”
Tuesday, February 10, 2015
Monday, February 09, 2015
Arnott: ‘Peasants With Pitchforks’ Seen If Profits Get Any Fatter
Rob Arnott, chief executive and co-founder of Research Affiliates LLC, recently picked up the phone to share some thoughts on the current state of the stock market.
Arnott is a pioneer of investing strategies that could be considered “unconventional” if they weren’t slowly but surely becoming more conventional. Among them is the idea of “fundamental indexing,” or weighting stock portfolios by economic metrics like sales, dividends and cash flows rather than the market value of the companies. (The term “smart beta” came later.)
As such, fundamental indexes tend to lean toward value stocks instead of growth stocks. How are they doing? Well, the FTSE RAFI U.S. 1000 Total Return Index returned 140 percent in the 10 years through 2014 compared with 114 percent for the Russell 1000 Index, even though growth far outperformed value in the same decade.
Anyway, when talking to a person like this, sometimes it’s best for a reporter to just shut the heck up, save the bad jokes for the next happy hour, and let the smarter person do all the talking. So here goes.
Q: Does it seem like the market will move back to a value orientation?
Bubble ‘Echoes’
A: “I think the market’s stretched both in terms of valuation levels and the spread between growth and value. It doesn’t feel like the tech bubble to me, it feels a little bit more like ’98 or early ’99 in terms of the magnitude by which things are stretched. But you do have some relatively extreme examples, companies that are trading at large multiples to revenue, let alone multiples of earnings or cash flow. And that hearkens back to the ’98-’99 experience. So I think we’re seeing echoes of the bubble in today’s global market behavior.
‘‘There is a flight to safety and the snapback from that, when it comes, will reward the value investor handily. You also see a huge spread between the comfort markets, the United States at a Shiller P/E ratio of 27 times earnings, and the fear markets, emerging markets, where a fundamental index in emerging markets is currently at a Shiller P/E ratio of 10 and a half. My goodness, 60 percent discount to the S&P 500. That’s startling. Why would it trade at such a vast discount? Because people are afraid. Fear breeds bargains. You cannot have a bargain in the absence of fear.”
(Note: Created by economist Robert Shiller, Shiller P/E ratios measure the price of an index divided by average inflation-adjusted earnings from the previous 10 years. Traditionally, P/E ratios measured either just the prior year’s earnings or forecasts for the next year’s profits.)
Q: What do you think about the Shiller P/E? Do you give it a little less weight considering the really bad earnings years during the recession? Does that skew it, or is that exactly what it’s meant to do?
Peasants, Pitchforks
A: “That’s exactly what it’s meant to do. It includes good times and bad times. Back in 2010 it included good years and two recessions, the ’02-’03 recession and the ’08-’09 recession. Now it includes two boom times and one deep recession, so I’m not troubled by including ’08-’09 at all.
‘‘Right now we have earnings coming off of record highs as a percentage of GDP and yet you have Wall Street saying ‘don’t worry, it’s going to soar to new highs.’ Pardon me, but when did the peasants with the pitchforks come out and start rioting? Society at large has to enjoy some of the largesse, or else the pitchforks come out. So earnings as a share of GDP can’t really advance materially from current levels, or at least it’s not healthy if they do.
‘‘So we’re looking at a likely mean reversion on earnings. What happens if there is mean reversion? Is the market ready for that? A strong dollar also points to mean reversion, when you get a strong dollar you usually get weak earnings, and the reciprocal for emerging markets and for Europe.”
Thursday, January 29, 2015
Hedge Fund Industry Profits To Fall 30 Percent: Citi
Although little changed in terms of fees and expenses in the hedge fund industry, performance took a bite out of profits in 2014
The hedge fund industry saw a decline of 29.8% in profitability in 2014, according to Citi’s 2014-15 Annual Hedge Fund Operating Metrics Survey. Citi found that in 2013, profits from the hedge fund industry were $31.2 billion, but in 2014, they fell to just $21.9 billion.
Little change in hedge fund fees
The firm’s analysts found, however, that very little changed within the industry. They did discover a “modest improvement” in operating margins despite there being little to no changes in the management fees Hedge Fundsare charging.
Total fees ranged from 1.55% to 1.73% last year, compared to 2013’s range of between 1.53% and 1.76%. Citi reports that hedge funds with between $7.5 billion and $14 billion in assets under management continued to charge the most in management fees. In 2013, the firm said the biggest hedge funds in their survey, which are those with more than $14 billion in assets under management, were charging the least amount of fees.
However, that changed in 2014, with the smallest hedge funds, or those with an average of $100 million in assets under management, becoming the funds with the lowest fees. Citi researchers said this demonstrates the necessity of the funds to “use economics” to attract funds.
“Not too much should be read into this shift, however, since the changes were so modest as to be statistically insignificant,” they added though.
Little change in hedge fund expenses either
Citi also didn’t find much change in average management company expenses. In 2014, the firm had 149 firms representing $580.9 billion in assets under managementin its data pool. In 2013, the data pool contained 114 firms with $415.2 billion in assets under management. (All graphs are courtesy Citi.)

However, even though Citi expanded its data pool, the firm said there wasn’t much change in operating expenses, as they remained within 7 basis points of where they were in 2013 for all firms that managed more than $350 million in assets.

Smaller hedge funds did see a noticeable decline in expenses though, as they fell from 244 basis points to 224 basis points for this category. Their average headcount remained at 10, although compensation was down in all categories except for compliance in 2014. Third-party expenses also fell, declining 23 basis points, and marketing expenses fell 20 basis points.
However an increase in technology spending partially offset those declines, as it rose 26 basis points.

Hedge fund performance plunges
Citi also found that the performance of the hedge funds in its study fell off “sharply” in 2013 in every tier of fund according to assets under management. Performance ranged from 2.9% to 5.5%, compared to 2013’s 8% to 13% performance.

As a result, the firm expects all hedge fund tiers to see “significantly” lower revenues from performance fees. This will especially impact smaller hedge funds, which Citi analysts believe will see their total performance fee pool fall from $6.7 billion to $2.9 billion in 2014.
Hedge fund industry profits
Based on the findings of the survey, Citi states that small hedge funds will see operating expense shortfalls of about $3.5 billion across the full tier, leaving them with only $2.9 billion in revenues from performance fees. Since all of that is needed to cover the shortfall, they remove it from “any potential measure of industry profits.”

That means there’s $18.3 billion left in their pool, and they expect half of that will be used to cover bonuses for hedge fund employees. The rest of it, they think will be carried forward as profit and thus be taxed at about 20% for capital gains. Their after-bonus, after-tax measure of performance fee profits is $7.3 billion. They combine that with the $14.6 billion they estimate in profits for management fees, thus resulting in their expectation of $21.9 billion in profits for the hedge fund industry, a nearly 30% year over year decline.

Sunday, January 25, 2015
Median Stock in MSCI World Down YTD (thru Mid-Dec)
The median year-to-date performance in the MSCI World Index with two weeks of trading left is -1%. The median stock was up 20% at this point last year and was up 13% at this point in 2012.

The developed country with the worst median performance YTD is MSCI Portugal. The median stock is down 35%. The developed country with the best median performance YTD is MSCI New Zealand. The median stock in MSCI New Zealand is up 14% in USD terms.


The major country indices in Europe are all unsurprisingly negative year-to-date. The median stock in MSCI Germany is down 10%, in MSCI France is down 10%, in MSCI Italy is down 12% and in MSCI Spain is 8%


The median performance year-to-date in the MSCI USA is 9%. The only other developed country indices with positive median performance YTD are MSCI Hong Kong (6%) and MSCI Ireland (6%).


Stock Market Leadership on a Country Basis Has Never Been Narrower
The United States stock market has been the only game in town. The US the only major developed country to have outperformed the MSCI World Index over the last year, joined only by the much smaller markets of New Zealand and Hong Kong.

Performance of Developed Market Countries Relative to MSCI World Index in USD:

Performance of Developed Market Countries Relative to MSCI World Index in USD:
Monday, January 12, 2015
The Wild, Wild East: Risks and Opportunities in Russia
Annexing Crimea, sponsoring a violent separatist movement in eastern Ukraine, and provoking many countries to impose economic sanctions—Russia has been in the headlines for the past nine months. In December the ruble fell by 32% in two days and the stock market fell by 22%. Both have since bounced back, largely recovering the short-term losses. While prudence cautions against concentrating one’s investments in Russia, current market prices offer alluring risk premiums. The ruble is cheap, interest rates are high, and dividend yields of Russian companies are among the highest in the world.
Investing in Russia has never been easy. In the 20th century, Russia defaulted twice, massively. Early in the century, the Bolsheviks seized all private capital. The previous owners lost not only their property but also their lives, if the Bolsheviks could find them. The disintegration of the Soviet Union at the end of the century produced a series of defaults. Western investors recall the 1998 default on government obligations that resulted in the collapse of Long-Term Capital Management. Those inside Russia remember the hyperinflation of the 1990s, which had the economic substance of a default by reallocating wealth from citizens to the government, and “privatization,” the redistribution of public property to a small group of new owners.
Today, Russia presents extreme risks and plentiful opportunities. The economic risk of low oil prices is compounded by risks arising from the country’s foreign policies and internal politics. The actions of Russia’s nationalist government in its ongoing conflict with Ukraine and the resulting economic sanctions imposed by the West are raising the odds of default. And yet, while markets are rightly fearful, Russia needs western capital and is willing to pay dearly for it.
Political Risk
With its vast and thinly populated area, Russia always feels threatened. Its political elite employs a security apparatus that seems paranoid to outsiders. Reflecting the fear that other powers plan to dismember the country, Russian foreign policy is oriented toward promoting puppet regimes in bordering countries. The leader of Kazakhstan has been in power for 25 years and the leader of Belarus for 20 years. These pro-Russian regimes in former Soviet states are undemocratic dictatorships, some with strong criminal inclinations.
Russia’s “friendly bordering dictator” doctrine is unstable and tends to backfire. When the populations of these bordering countries become fed up with the Russian-supported dictator and try to install a more responsive government, Russian authorities interpret the political movements as anti-Russian plots instigated by foreign intelligence services to undermine Russian security.
Internally, Russia’s political and civil institutions are centralized and archaic. Russia does not have an effective multiparty democracy; it is a one-party state. United Russia is a political machine for Vladimir Putin to direct the bureaucracy and drive legislation through the parliament. The principle competition is the Communist party, whose agenda is to re-nationalize the economy. The third largest party represents ultranationalists who espouse even harsher militaristic policies than Putin’s. To be sure, these other parties are more political theater than serious opposition.
Putin and his “party” control the Russian media. The stories told on TV remind western observers of Orwell’s novels. Russia tolerates a small nongovernmental media sector that allows independent voices to let off steam—but in a controlled way. The Russian government has learned that countenancing the appearance of unhampered thought enables it to control information even more effectively. Orwell did not foresee this tactic.
The Russian legal system is subservient to its political leadership. As a result, Russian companies, both state-owned and private, suffer from official corruption. Investors need to take financial reports with a grain of salt. A telling fact, in 2002 Gazprom received an Ig Nobel prize in economics for “adapting the mathematical concept of imaginary numbers for use in the business world.” To be fair, Gazprom shared its prize with Enron and many other companies. Nevertheless, investors scrutinize Russian financial reports with skepticism. As in other emerging markets (and a few developed markets too), the regime often redirects cash flow to its political priorities and away from investors.
Economic Risk
On a map of the world, Russia is hard to miss. It is the largest country by surface area. Nonetheless, Russia is sparsely populated and has an undiversified economy.1 Covering one-sixth of the dry surface of the earth, Russia holds huge reserves of mineral deposits. In international trade, Russia mainly focuses on exporting its natural resources. Close to 70% of Russian exports are energy related (see Figure 1). When energy prices fall, the country’s revenue stream tends to dry up.

The price of oil fell from $100 at the end of June 2014 to $60 in December 2014. This dramatic drop in fossil fuel prices is partly explained by technological advancements in natural gas and oil extraction in the United States, boosting supply, and partly by temporarily depressed demand due to slowing growth in China and Europe. The lower price of energy, Russia’s principle export, has certainly caused economic pain. But that’s not the whole story. Other countries that are heavily dependent on oil export revenues—for example, Norway and the United Arab Emirates—are not experiencing Russia’s levels of inflation, currency turmoil, and stock market instability.
Default Risk
Why do investors fear a Russian default? To begin to understand today’s default risk, consider the structure of the Russian debt to outsiders, shown in Figure 2.

Russia’s current foreign debt is not large: $731 billion, or about 34% of Russia’s annual GDP. Direct government debt is $73 billion and state-owned banks and corporations owe an additional $304 billion. By international standards this is benign. U.S. external debt is close to 100% of GDP, for example. In consideration of Russia’s $478 billion currency reserves, accumulated over the past decade, it seems absurd to worry about default.2 Events in Ukraine, as much as the drop in oil prices, are the catalyst for the current Russian financial crisis. When Ukrainians decided to oppose the transformation of their government into another “friendly bordering dictator” regime, Russia annexed Crimea and instigated a militant separatist movement in eastern Ukraine. While the Georgian conflict in 2008 was short and limited in its effect on the Russian economy (Lawton and Beck, 2014), the Ukrainian conflict has had a much bigger impact. Russian and pro-Russian maneuvers resulted in thousands of deaths (including the 283 passengers and 15 crew members aboard a Malaysian airliner that was shot down in September 2014). In response, Western powers imposed economic sanctions.
To date, the sanctions have been relatively mild. They are nowhere close to the sanctions imposed on Iran, Cuba, or North Korea. Many countries, notably Germany, rely heavily on energy imports from Russia and oppose outright trade restrictions. European banks are ill positioned to absorb defaults on Russian debt. If the present Russian military line persists or becomes more aggressive, then there is room for significantly harsher sanctions; but under the comparatively weak sanctions now in force, Russian companies still generate sufficient revenue to service their debts.
Thus the present crisis is a solvency problem, not an inability to service debts. Many Russian companies need to refinance their hard-currency debts. Sanctions prohibit this refinancing. Russia’s biggest oil company, Rosneft, seems to have created the turmoil which caused the ruble to drop so sharply in December. According to the Financial Times (2014), Rosneft has $19.5 billion in debt due next year. If oil prices stay at the current $60 a barrel level, its revenue will cover only $15 billion; it is short $4.5 billion. Rosneft recently placed the equivalent of $10.8 billion in a ruble-denominated bond offering, and it is rumored that the company substantially converted the proceeds into dollars to replenish its reserves. Apparently, this transaction caused the recent panic in the currency and stock markets.
Rating agencies forecast a chain of bankruptcies and have already lowered Russian sovereign and private credit ratings. The Russian central bank has resorted to emergency measures. In addition to facilitating the Rosneft bond deal, it raised interest rates to 17% (from 10.5%) to make ruble accounts more attractive and discourage residents from converting rubles into foreign currencies.
Opportunity for Investors
Logically, this crisis should pass. Russia has ample internal reserves. Europe relies on Russian energy and it will take decades of infrastructure investment to lower this dependence. Russia needs foreign capital and foreign technology to improve its economic efficiency. Many sectors of the Russian economy are shockingly unproductive: A Russian worker is about 70% as productive as a Chinese worker and about 17% as productive as a U.S. worker.3 If the Russian government does not further escalate its intervention in Ukraine, or even softens its political position, then investors might profit handsomely from the current investment opportunities.
The Russian government can also afford, however, to advance a significantly tougher military policy in Ukraine. Russian citizens have endured rougher economic environments. When in the 1990s the income of ordinary Russians fell to African levels, many relied on homegrown vegetables to survive. Putin’s approval ratings today are at all-time highs (close to 85%). Those considering investing in Russia should recognize the rising risk of loss through default and/or nationalization. In investing, what is comfortable is rarely profitable. Investing in Russia now is definitely discomfiting, but it might pay off in the long run.
Endnotes
1. Russia is the ninth largest country in the world (between Bangladesh, the eighth, and Japan, the tenth). Its population is mostly concentrated in the European part of the country. Russia is also ninth by total GDP (between Italy, the eighth, and India, the tenth).
2. To understand incentives to default, it is helpful to consider the net investment position of Russia, or how much Russia owns outside its borders minus how much Russia owes to foreigners. The net investment position of Russia is approximately positive 9% (as of June 2014)—Russia owns more than it owes—and it is therefore not in its interest to default. For comparison, the net investment position of the United States is –38% (as of September 2014). Data sources: The Central Bank of the Russian Federation, the World Bank, and the U.S. Department of Commerce Bureau of Economic Analysis.
3. Bush (2009) attributes the figures mentioned here to Strategy Partners, a Moscow management consultancy. He also refers to a survey conducted by McKinsey estimating a somewhat higher level of productivity: a Russian worker is 26% as productive as a U.S. worker.
References
Bush, Jason. 2009. “Why Is Russia’s Productivity So Low?” Bloomberg Businessweek (May 8).
Financial Times. 2014. “Rosneft and BP: Trading Problems. December 17.
Lawton, Philip, and Noah Beck. 2014. “The Ukrainian Crisis: Should Investors Avoid the Russian Stock Market?” Research Affiliates (April).
Please note that transactions in new issues of certain Russian debt and equity securities are subject to directives issued by the U.S. Treasury Department’s Office of Foreign Assets Control (OFAC) and certain transactions involving specifically listed individuals and securities are prohibited by law. More information regarding these sanctions and related directives can be found at http://www.treasury.gov/resource-center/sanctions/Programs/Pages/ukraine.aspx.
The Danger of One Year Performance Numbers
“Investment wisdom begins with the realization that long-term returns are the only ones that matter.” – William Bernstein
Now that 2014 is in the books, I’m starting to see the usual flood of annual performance reviews to show what worked and what didn’t. I’ll save you some time – U.S. large cap stocks and long-term U.S. treasury bonds were the place to be and outperformed just about everything else to some degree.
As you read these pieces you get the sense that the authors are shaming you for not being invested exclusively in only the best performing assets. This myopic view of a single annual period completely misses the point of long-term investing and it’s the reason most people fail when implementing a portfolio strategy.
Assuming you have a legitimate investment plan in place, you should never feel ashamed that your portfolio doesn’t keep up year-in and year-out with the best performing strategies. It’s madness to think that way. It can only lead to stress and future pain from chasing the wrong types of investments.
Everyone preaches risk management right up to the point that annual performance figures are updated. That’s when the insanity of the performance chase and second guessing begins. Every single year long-term investment strategies “die” or “fail to work.” And every single year gullible investors fall into the trap of assuming they’ll be able to pick and choose the best performing asset classes.
The best long-term investment strategies will never be the best performers in any given year. They only show their true colors over much longer periods.
As Rick Ferri once said, “Asset allocation is for patient people.”
Monday, January 05, 2015
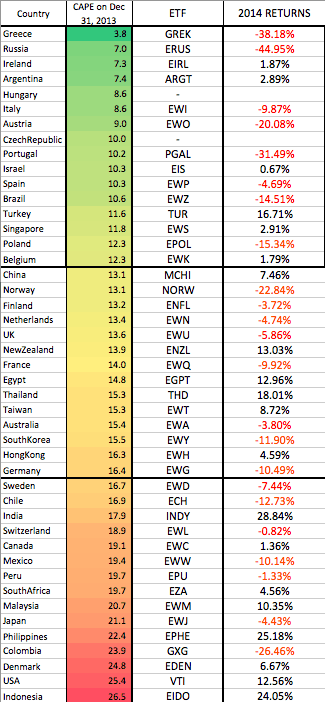
How did CAPE do in 2014?
Readers know that I am a fan of using long term valuation metrics as a fundamental anchor to pick stock markets around the world. It worked great in 2013, but in 2014 that worked fairly poorly as many of the cheap markets have gotten even cheaper.
The median stock market had a negative year in 2013 of -1.33%
The average of cheap markets (defined as cheapest 25%) declined -12.88%
The average of expensive markets gained 1.36%.
The names have shifted around a little bit (I sent updated values to Idea Farm members earlier today) but the cheap ranks are still dominated by the continent across the Atlantic, and Russia and Brazil…
Subscribe to:
Posts (Atom)
Lunch is for wimps

It's not a question of enough, pal. It's a zero sum game, somebody wins, somebody loses. Money itself isn't lost or made, it's simply transferred from one perception to another.