Tuesday, May 27, 2014

Here Is The Mystery, And Completely Indiscriminate, Buyer Of Stocks In The First Quarter


With the Fed having tapered its liquidity injections into the stock market from $85 billion to "only" $45 billion per month, retail investors getting burned by the recent high beta and momentum stock flame out and "greatly unrotating" into the renewed safety of bonds, not to mention a churning market that until last week was unchanged for the year, and hedge funds ever shorter into this latest ramp, many are asking themselves: who is buying?
Here is the answer.
According to the most recent CapitalIQ data, the single biggest buyer of stocks in the first quarter were none other than the companies of the S&P500 itself,which cumulatively repurchased a whopping $160 billion of their own stock in the first quarter!
Should the Q1 pace of buybacks persist into Q2 which has just one month left before it too enters the history books, the LTM period as of June 30, 2014 will be the greatest annual buyback tally in market history.
And now for the twist.
Unlike traditional investors who at least pretend to try to buy low and sell high, companies, who are simply buying back their own stock to reduce their outstanding stock float, have virtually zero cost considerations: if the corner office knows sales and Net Income (not EPS) will be weak in the quarter, they will tell their favorite broker to purchase $X billion of their shares with no regard for price: the only prerogative is to reduce the amount of shares outstanding and make the S in EPS lower, thus boosting the overall fraction in order to beat estimates for one more quarter.
Compounding this indiscriminate buying frenzy is that ever more companies (coughaaplecough... and IBM of course) are forced to issue debt in order to fund their repurchases. So since the cash flow statement merely acts as a pass-through vehicle and under ZIRP companies with Crap balance sheets are in fact rewarded (as even Bloomberg noted earlier) the actual risk of the company mispricing its stock buyback entry point is borne by the bond buyer who in chasing yield (with other people's money) serves as the funding source for these buybacks.
In short, corporate CEOs and CFOs couldn't care less if your friendly Wall Street broker uses the repurchase allocation to buyback the stock at all time highs.
In fact, since a vast majority of executive compensation agreements are tied to company stock "performance" C-suites are perversely happy if their own corporate cash is used to buy the stock near or at all time highs: after all management year end bonus will simply benefit that much more, while keeping activist investors delighted (and away from the embarrassing public spotlight).
So the next time someone asks who keeps on buying stock despite all the negative newsflow, despite the bond yield sliding ever lower despite relentless broken-record pleas that a "recovery is just around the corner", and with vol near all time lows confirming peak complacency... now you know.
* * *
Want more data? Here is buyback activity by year. While the 2007 S&P500 buyback record of just over $560 billion is safe for a few more weeks, should companies buyback as much stock in Q2 as they did in Q1 2014, then the Q2 2014 LTM buyback total will rise an all time high:

Don't forget: there is no such thing as a free lunch, bought with stock buybacks or otherwise. Contrary to all the lies you may have heard, corporate debt - both total and net - is now at an all time high!


Finally, these are the companies that are the most aggressive repurchasers of their own stock, or said otherwise, the companies that have no organic use for the cash and have zero ideas how to grow their top and bottom line or what capital projects to invest their excess capital, they only have stock buybacks as an option to give the impression of "growth."
Source: CapIQ
4.98039
Your rating: None Average: 5 (51 votes)
 
Tue, 05/27/2014 - 14:23 | 4799049DoChenRollingBearing
DoChenRollingBearing's picture
Well, that explains that, I guess.  I'm just hanging on for the ride, waiting for the time to bail...
Tue, 05/27/2014 - 14:26 | 4799055TheRideNeverEnds
TheRideNeverEnds's picture
[spoiler] It never ends [spoiler]
Tue, 05/27/2014 - 14:29 | 4799068NoDebt
NoDebt's picture
Must be working.  10 more S&P points today.  Only 40 off of Goldman's NEW 1-year-from-now target number.  If we hit 1950 by next week who wants to be me they won't raise the target again?
Tue, 05/27/2014 - 14:34 | 4799078eclectic syncretist
eclectic syncretist's picture
It worked in Japan in the late 1980's and in the US in the late 1990's too, all they way up until it didn't work any more.
Tue, 05/27/2014 - 14:51 | 4799122nope-1004
nope-1004's picture
So.... is the "money on the sidelines" meme a thing of the past now?  Like "green chutes"?  That didn't take long.

Tue, 05/27/2014 - 14:51 |4799126Pladizow
Pladizow's picture
Soon....very soon....Skynet will own all.
Tue, 05/27/2014 - 14:57 |4799151dontgoforit
dontgoforit's picture
Isn't this like Green Giant buying it's own corn?
Tue, 05/27/2014 - 16:24 |4799405Ham-bone
Ham-bone's picture
Ok - crazy stuff...since '09, the the difference between the budget and trade deficits has very closely correlated w/ the "foreign Treasury demand"...which is to say as their was less excess dollars to be recycled by Foreigners into Treasury's, "foreigners" somehow increased their buying to soak up the excess debt  and @ progressively lower rates.  See (in bold) Foreign Treasury yoy increase in demand on left and  (in bold) Treasury debt yoy in excess of trade deficit on right...
This is in stark contrast w/ pre-crisis...
Is this the most blatant evidence the Fed is truly running a shadow QE through "foreign" locations???  If not, please explain...
Data Below....
Yr. - Foreign - Fed (y o y) = total /   Bud  /   Trade  / GDP / (Fed action)
        T buy       T buy                    Deficit / Deficit
     $6.1 T      $2.4 T (total holdings as of '13)
14. $250 B   $300 B   = $550 B / $-150  (-550) (-400) (-0.5%) est.
13.  $219 B    $542 B   = $760 B /$-205  (-680) (-475)  (1.9%) + tax hike (QE3)
12. $619       $21   = $640 / $-565  (-1100) (-535) (2.8%) (Twist)
11. $733      642   = $1375 / $-742  (-1299) (-557) (1.8%) (QE2)
10. $631      $245   = $876 / $-795  (-1294) (-499) (2.5%)
09. $672      $301   = $973 / $-1029  (-1413) (-384) (-2.8%) + tax reduction (QE1)
Post Crisis
08. $1147 $(-265)  = $880 / $243 B (-459) (-702)   (-0.3%) (FFR 0%) + TARP
07. $279    $(-39)   = $240 / $539 B (-161) (-700)   (1.8%)
06. $75         $35    = $105 / $504 B (-248)  (-752)  (2.7%)  (FFR 6.75%) 
Tue, 05/27/2014 - 16:26 | 4799483dontgoforit
dontgoforit's picture
Ahso!  They are actually increasing QE while lying about it?  Hang the bastards!  They are taking the world to the precipice of destruction.
Tue, 05/27/2014 - 16:35 | 4799519Bay of Pigs
Bay of Pigs's picture
You know the William Dudley is getting this all done via the BIS. All Central Banks are involved.
Tue, 05/27/2014 - 18:41 |4799896El Oregonian
El Oregonian's picture
This must be the prelude to the guy who held his breath going through a tunnel but failed to reach the otherside before he passed out and caused a 3-car accident in the tunnel.
The banksters are holding their collective breath.
Tue, 05/27/2014 - 16:37 | 4799526SafelyGraze
SafelyGraze's picture
buying back your stock is like drinking your pee
sure, it may seem creepy to other people
but in the desert you gotta do what you gotta do
don't forget your stillsuit 
Tue, 05/27/2014 - 16:44 |4799564ATM
ATM's picture
No it isn't. If a company can borrow money for nothing why wouldn't it buy back almost all it's stock? Hell, they should all be going private! 
That's not creepy. That plain old good sense in the world of insane centralized planning.
Tue, 05/27/2014 - 17:46 |4799748nope-1004
nope-1004's picture


"why wouldn't it buy back almost all it's stock?"
Because buying inflated phantom assets is risky, especially since the only evaluator (elevator) is (has been since 2000) the Fed.
If you rob Peter to pay Paul, who does Paul sell to?

Tue, 05/27/2014 - 18:18 |4799839Budd aka Sidewinder
Budd aka Sidewinder's picture
Jesus
Tue, 05/27/2014 - 19:50 |4800090free_lunch
free_lunch's picture
But.. but.. "I can't eat an iPad".
Tue, 05/27/2014 - 16:58 | 4799539Ham-bone
Ham-bone's picture
in '13 - the US generated $205 B more in debt than trade deficit to be recycled to buy it...but magically the "foreign" demand increased by $219 B to buy up that debt
in '12 - $565 B more in debt than trade deficit...and magically "foreign" demand increased $619 B
in '11 - $742 B more in debt than trade deficit vs. $733 new "foreign" demand
'10 - $795 B vs. $631
quite a coincidence that "foreigners" would want to recycle more net dollars than the US is creating via it's trade deficit...and funny they'd want to do it at ever lower yields...and despite global trade being done progressively lless in dollars...
Tue, 05/27/2014 - 17:06 |4799636buyingsterling
buyingsterling's picture
I'd love to bookmark the original source if you can post it.
Tue, 05/27/2014 - 16:54 | 4799596SAT 800
SAT 800's picture
Look behind you, the precipice is that end of the road there hanging out in space about fifty yards back.
Tue, 05/27/2014 - 18:10 |4799810OldPhart
Tue, 05/27/2014 - 18:01 | 4799790free_lunch
free_lunch's picture
Not destructing, more like buying the world.. Keep the profits in the family kind-a-thing?
Tue, 05/27/2014 - 16:34 | 4799513gdpetti
gdpetti's picture
That's what the currency swaps were for and continue so today... said to be over 30 trillion years ago, who knows about today... James Rickards was talking about this the other day. It seems the EU is fronting for the Fed these days, thus the whole Belgium scenario.
Tue, 05/27/2014 - 17:19 | 4799621Ham-bone
Ham-bone's picture
you mean this...
GLOBAL BANKING CENTERS (treasury holdings)
  • ————- Jan ’00—> ’07 ——> Mar ’14
  • “Carribean banking centers”
  • —————$35 B —> $68 B -—> $312 B
  • UK — ——-$50 B —> $100 B —> $176 B
  • Switzerland $18 B —> $34 B —-> $176 B
  • HK ———– $39 B —> $52 B —> $156 B
  • Singapore —$30 B —> $30 B —–> $91 B
  • Ireland ———$5 B -—> $19 B —> $113 B
  • Belgium ——$28 B ––> $13 B —> $381 B
  • Luxemburg —-$5 B ––> $60 B —> $145 B
  • TOTAL —– $210 B –> $376 B —> $1,550 T (410% increase from ’07)
In the same period ('07-'14), Japan and China (combined) increased their Treasury holdings by net $1.4 T on a trade surplus w/ the US of $3 T over the period...Amazingly these banking nations similarly had a $1.2 T increase w/ relatively no trade surplus w/ the US???  Hello Treasury demand well in excess of trade deficits!!!
Tue, 05/27/2014 - 17:25 |4799703Tinky
Tinky's picture
Keep hammering this home, Ham! It won't be too long before sober economic pundits point it out after doing forensic accounting in the wake of the impending crash.
Tue, 05/27/2014 - 19:44 |4800071free_lunch
free_lunch's picture
Seems half the west has it's eggs in the US basket..

"And we would all go down together":http://www.youtube.com/watch?v=qKFEfR_Q16I
Tue, 05/27/2014 - 14:56 | 4799147Headbanger
Headbanger's picture
This means there is virtually no market participation of buyers but only a few CFOs propping up the """market""" now.
Me thinks their primary motivation is to reduce the number of shares outstanding to boost EPS maybe in seeing the economy falling fast.

Tue, 05/27/2014 - 15:31 |4799302TheReplacement
TheReplacement's picture
Dear So-n-So CEO person,
The NSA informs us that you have been looking at naughty pictures of little kids.  Well, even if you haven't been, the pictures are on your computer now.  Let's just keep this between us.  Nobody, not you, me, your company, nor our country needs this scandal now. 
So if you know what is good for you, you will take the the money we are offering to loan you and buy back your company's stock.  Just think, if you do a good enough job your EPS will look great and you'll get a big fat bonus.
Sincerely,
TPTB
PS - Don't leave town.
Tue, 05/27/2014 - 15:00 | 4799160t0mmyBerg
t0mmyBerg's picture
This meme has been building for awhile.  I wrote to my guys a few months ago about buybacks as the ultimate reason stocks are at all time highs.  And why not?  If your borrowing costs are close to 0, then you can keep the bonuses flowing by borrowing and reducing the float.  You get rich for essentially doing nothing of any value at all.  Thanks Fed!  So when does it end?  When there is actually a cost to borrowing money (you mean money has a time value? What?).  When will that happen?  If you believe the talking heads, any day now.  Realistically, it may be quite a while.  Although Kyle Bass seems to think that the Fed will THINK their econ forecasts are spot on (they aren't) and raise rates just as the nex recession starts.  Nice work if you can get it.  What a fucking bunch of brass asshats.
Tue, 05/27/2014 - 15:26 |4799270Jstanley011
Jstanley011's picture
So, you're saying that artificially holding down interest rates wasn't such a good idea after all? Whooda thunk?...
Tue, 05/27/2014 - 16:14 |4799449SAT 800
SAT 800's picture
just think of it as a new wonder medication; that has a few "side effects".
Tue, 05/27/2014 - 14:37 | 4799083ArkansasAngie
ArkansasAngie's picture
I'm guessing they don't mind being front run either?  
Tue, 05/27/2014 - 14:27 | 4799060Badabing
Badabing's picture
i just pulled $100 out of my left pocket and put it into my right!
easy money
Tue, 05/27/2014 - 14:28 | 4799066LawsofPhysics
LawsofPhysics's picture
What's your fee?
Tue, 05/27/2014 - 14:58 | 4799130nope-1004
nope-1004's picture
New accounting rules stipulate he can mark to mystery, so really he took out $100 and gave the right hand $50, losing $50.  The Fed will cover the loss of $50, PLUS he gets a bonus at year end for "having 100% return on his capital".  lmfao...  and prolly zero days of trading losses.

Tue, 05/27/2014 - 14:29 | 4799069Dr. Richard Head
Dr. Richard Head's picture
You are now qualified to be a Professor at an Ivy League School!!!  Congratulations are in order.
Tue, 05/27/2014 - 14:36 | 4799082Pool Shark
Pool Shark's picture


Ivy League Professor???!!!
Hell, Krugman got a Nobel Prize utilizing that same logic...


Tue, 05/27/2014 - 14:42 | 4799102machineh
machineh's picture
Logic? He found it enclosed as a bonus, in an order of shrimp tacos.
Tue, 05/27/2014 - 14:58 |4799157dontgoforit
dontgoforit's picture
Obama got a Nobel prize for...being born?
Tue, 05/27/2014 - 15:24 |4799264RealityCheque
RealityCheque's picture
No he got it for killing brown people in other countries.
Excelsior!!!
Tue, 05/27/2014 - 17:01 |4799613SameAsItEverWas
SameAsItEverWas's picture
Obama got a Nobel prize for...being born?
Born in Kenya like his father was, per his Harvard Law Review bio?
We need a Canuck in the WH.  Ted Cruz in 2016!
Tue, 05/27/2014 - 14:55 | 4799124Chupacabra-322
Chupacabra-322's picture
Bilderburg attendee:
USA Feldstein, Martin S. Professor of Economics, Harvard University;
USA Summers, Lawrence H. Charles W. Eliot University Professor, Harvard University
Tue, 05/27/2014 - 16:13 | 4799445SAT 800
SAT 800's picture
But do they go to the same Synagogue?
Tue, 05/27/2014 - 16:36 | 4799521Kirk2NCC1701
Kirk2NCC1701's picture
Moral:  You many not be able to pick your parents, but youcan choose where to study or worship, if getting to the Top matters to you.
Tue, 05/27/2014 - 15:19 | 4799241valley chick
valley chick's picture
Even this valley chick gets it.  Who needs a stinking degree nowadays!:-) 
Tue, 05/27/2014 - 15:44 | 4799349Miffed Microbio...
Miffed Microbiologist's picture
Even a microbiologist does too. Unfortunately, getting it in this case doesn't mean you can do any damn thing about it which frustrates the hell out of me at times. How long this scenario can be propelled by fumes is a never ending source of personal contemplation. Sometimes I feel like Bill Murray in Groundhog Day.
Miffed;-)
Tue, 05/27/2014 - 16:12 | 4799442SAT 800
SAT 800's picture
NO; as you were transferring the money, members of the public saw you doing it, and decided you must be a successful business man, so they offered to invest their money with you; and after you gave them little pieces of paper saying they had invested with you, you put $127, in your right hand pocket. The suckers provide Beta on t he actual.
Tue, 05/27/2014 - 14:27 | 4799064LawsofPhysics
LawsofPhysics's picture
Leverage is "free", so why not?  I wonder what happens should they decide to sell?  If these stocks go "bidless" what happens?
Tue, 05/27/2014 - 14:32 | 4799077NotApplicable
NotApplicable's picture
Wake up Kevin Henry?
Tue, 05/27/2014 - 15:33 | 4799310ForWhomTheTollBuilds
ForWhomTheTollBuilds's picture
OH!  OH!!!  I KNOW!

They change the rules?

Friday, May 23, 2014

Risk Parity – What’s in a Name?

Risk Parity funds enjoyed notable fundraising success between 2008 and mid-2013. Investors found the funds’ concept of making money throughout market cycles, whether high or low growth, inflation or deflation, to be quite compelling following the Financial Crisis, only to be surprised midway through last year by an environment unfavorable to investors with exposures to both nominal rates and commodities.
Some see Risk Parity strategies as a valid inclusion in a diversified portfolio, while detracting views range from fundamentally flawed to downright dangerous . What role, then does this strategy have to play? The lively industry discussion, as well as the projected inflows earmarked for these funds (after some outflows in Q1 stemming from 2013’s losses), led us to employ quantitative analysis to take a closer look at some of the characteristics of these enigmatic funds.
We applied MPI’s proprietary Dynamic Style Analysis (DSA) to a set of 40 Act funds employing the strategy and found a surprising disparity between these funds in terms of varying estimated asset exposure and implicit leverage levels. This wide range of risk and exposures defies easy comparison and classification, and warrants investors’ careful consideration when evaluating allocations.
As a brief reminder, the fundamental premise of Risk Parity strategies is that the volatility of returns in traditionally balanced, asset-weighted portfolios is driven almost entirely by the most volatile components, which are typically equities.   The argument concludes that traditional portfolios are not sufficiently diversified in different economic environments.   Instead, the Risk Parity approach attempts to allocate risk[1] contributions equally between major asset classes (generally including but not limited to stocks, bonds, and commodities), with an expectation the portfolio will provide “attractive, relatively stable” performance throughout different economic regimes.
While the majority of Risk Parity assets are managed in institutional portfolios, some institutional asset managers have made the leap to offering mutual fund versions of their strategy (though current investment minimums may limit retail ubiquity).   The frequency of the data and relative transparency of these 40 Act products better lend this small set to a review of the strategy’s implementation.   In the analysis that follows, we view seven mutual funds identified as following a Risk Parity strategy[2], looking at their behavior through 2013 and the first quarter of this year, their approach to the Risk Parity model, and what this means for investors who may be analyzing these funds.
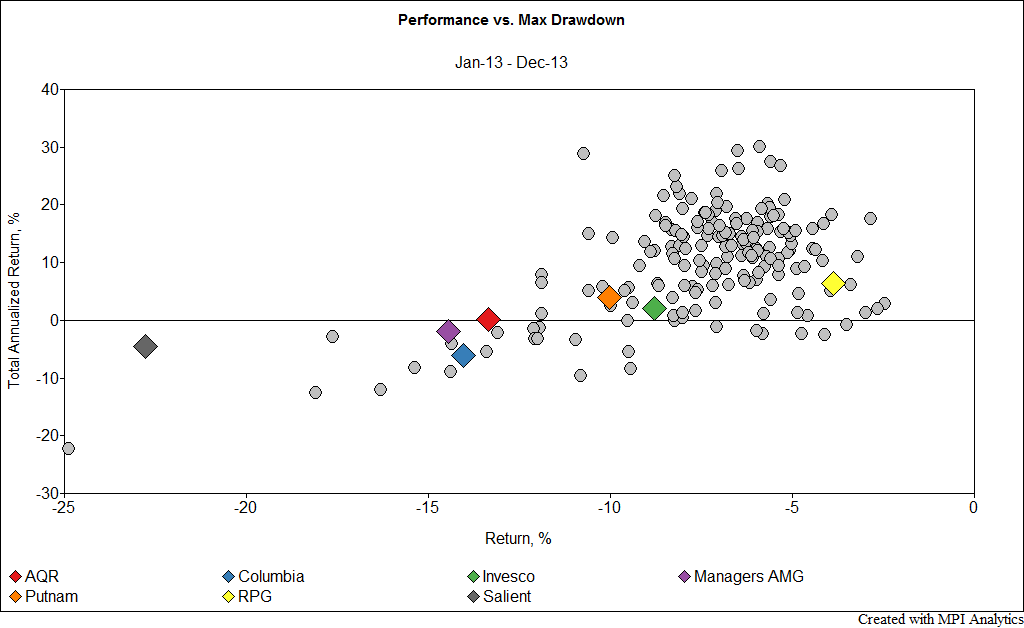
The chart below shows the total performance and Max Drawdown of the seven funds over the course of 2013 against the background of their combined World Allocation and Tactical Allocation peers, as classified by Morningstar[3]. It can easily be seen that six funds are outliers in terms of both performance and losses realized over the course of the year. Note also that the funds differ significantly from each other, an indication that categorizing and setting behavioral expectations and benchmarks may not be a simple task.
Peer_sml
The variance likely results from a wide variety of interpretations and implementations of the same basic premise of equal budgeting between risk factors, and can be further examined through an estimate of the funds’ asset exposures over the course of 2013 and the first quarter of 2014.[4]
Because these are mutual funds, holdings are readily available. This level of transparency is helpful, butit is still often very difficult to determine a fund’s net exposures from point-in-time holdings data. The Putnam fund has over 1000 holdings, according to filings, while the Columbiafund invests in a handful of underlying products, effectively functioning as a fund of funds. DSA can be used to analyze the exposures of the funds over the course of the last 15 months, helping to explain the disparity in their performance by the behavior of their returns and those of a replicating portfolio [5][6] of factor indexes. Here is what we found:
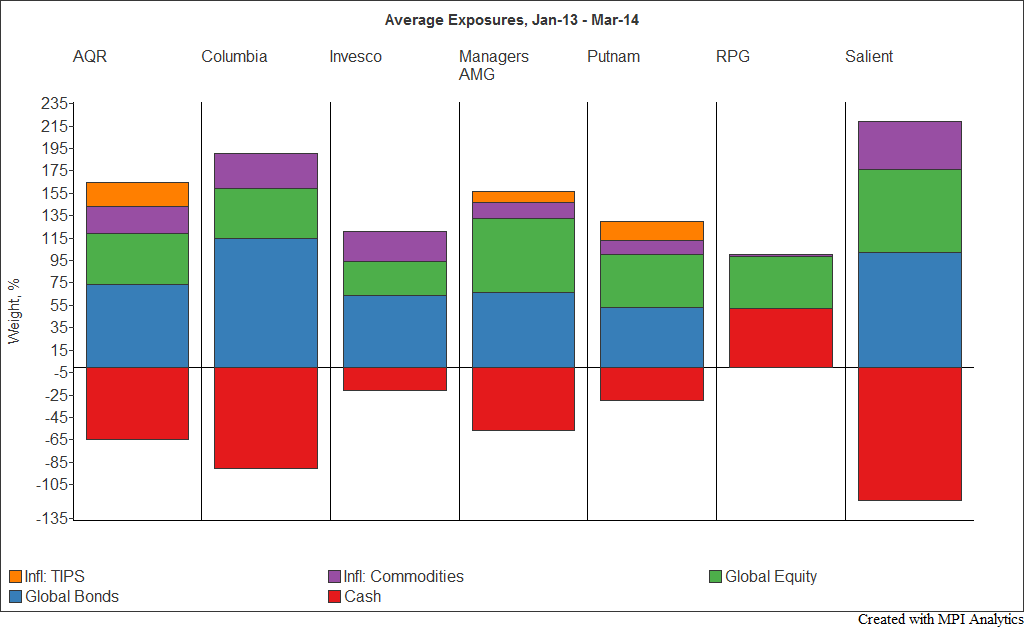
The average exposures[7] over the entire time period, as well as the degree of implied leverage[8] varies greatly between funds.
Avg_sml
Implied leverage across the group ranges from nonexistent (positive Cash exposure) to over 100%. The gross exposures are clearly disparate, but the relative weights of the asset classes in the portfolio (unlevered and rescaled to 100%) also differ greatly. Exposure to the “Global Bonds basket” ranges from 40% to 60%, while Equity exposures range from just over 20% to greater than 40%. Three of the funds employ TIPS in their “Inflation basket”.
Beyond these broad buckets are major differences in the underlying exposures. For example, some funds seek credit exposure as well as more rate-sensitive government bonds.   Some allow investment in emerging markets (either bonds, equities or both) while others only consider developed markets, etc.
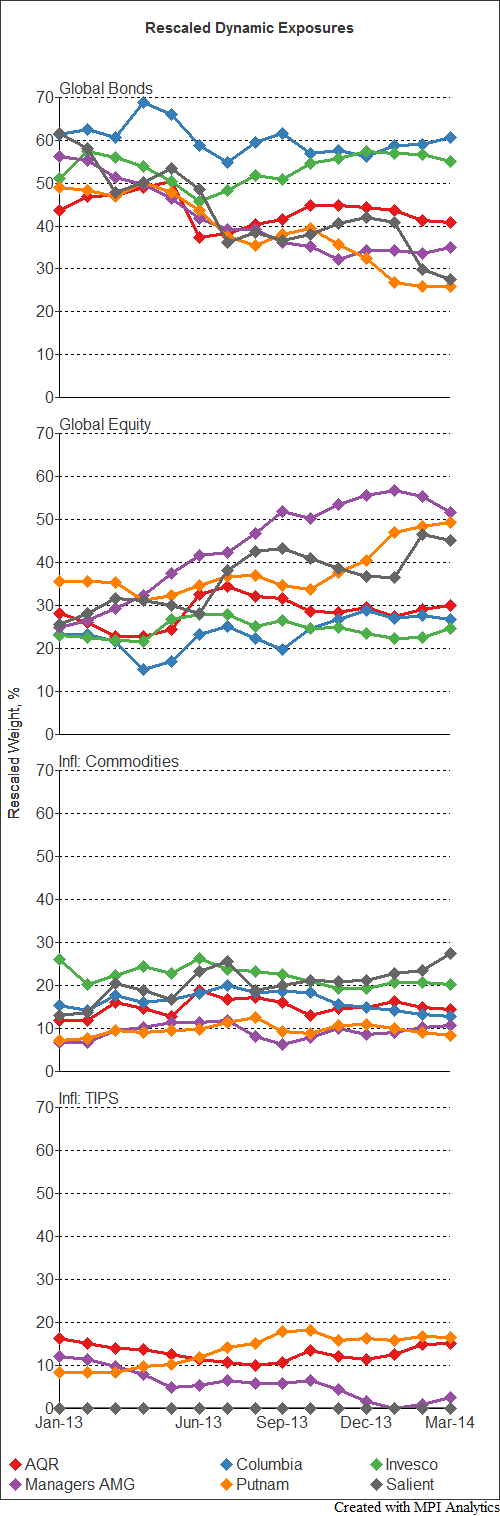
A snapshot illustrates the difference in average exposures, but a review of the dynamics of the exposures over the past 15 months shows even greater differences in the funds’ perceived approaches to the strategy[9].
Polling_sml
As could be expected given volatility levels following Bernanke’s “Taper Talk” in May, there is a general downward trend in Global Bonds exposure since the beginning of 2013 though the degree of change is not universal. Several funds’ exposures are estimated to have remained relatively steady, with only a minor decrease, while the Salient fund’s & the Putnam fund’s exposure estimates to Global Bonds are approximately half what each was a year ago.
There is a corresponding increase in equity exposure for most funds, but again the degree to which this occurs is broad, with AMG showing the largest increase in Equity exposure.
Comparatively, relative Commodities exposures remain fairly steady, although there is a notable increase in Salient’s estimated exposure. Estimated allocations to TIPS, the other portion of the inflation basket, all move in different directions, with the Putnam fund doubling its exposure, the AMG fund reducing its exposure, while the AQR funds’ exposure remains relatively steady.
Not readily apparent from the chart above is that in terms of overall relative exposures, the AQR, Invesco and Columbia funds remain fairly consistent, while the others appear to engage in much more dynamic allocation over the period.
Conclusion
The bottom line is that these seven Risk Parity mutual funds demonstrate – by the behavior of their returns and common exposures – that there is significant room for interpretation in the same nominal strategy. These quantitative incongruities potentially reflect vastly different philosophies and execution on the part of product providers. As our analysis shows, there does not appear to be a risk level that is common to our sample of funds; the exposure charts showcase how ostensibly differing estimates of future volatilities of various asset classes can lead to substantially different portfolios and performance.
Absent these differences from a quantitative standpoint, the fledgling 40 Act group also lacks unanimity in market classification, with four of the funds classified in the Morningstar Tactical Allocation category, two in the Morningstar World Allocation category, and another lives in the Multialternative category. As the discussion continues, investors should take the time to carefully analyze these funds before making investment decisions and setting expectations.
[1] Most often defined as standard deviation of returns
[2] Morningstar does not currently have a distinct category for Risk Parity funds. As such, the seven are manually selected. Some families offer multiple funds (usually with different risk targets), however only a representative fund was selected from each family. The funds are: AQR Risk Parity I, Columbia Risk Allocation A, Invesco Balanced Risk Allocation A, Managers AMG FQ Global Risk-Balanced , Putnam Dynamic Risk Allocation A, RPG Diversified Risk Parity A, Salient Risk Parity I.
[3] Four of the funds are in the Morningstar Tactical Allocation category, and two are in the Morningstar World Allocation category, while one is in the Multialternative category.
[4] DISCLAIMER: MPI conducts performance-based analyses and, beyond any public information, does not claim to know or insinuate what the actual strategy, positions or holdings of the funds discussed are, nor are we commenting on the quality or merits of the strategies. This analysis is purely returns-based and does not reflect insights into actual holdings. Deviations between our analysis and the actual holdings and/or management decisions made by funds are expected and inherent in any quantitative analysis. MPI makes no warranties or guarantees as to the accuracy of this statistical analysis, nor does it take any responsibility for investment decisions made by any parties based on this analysis.
[5] This analysis was performed using the same factors and parameters for all seven funds in order to provide a basis comparison. Please note that this is not the best combination for any individual fund. Specific exposure estimates will differ when an individually selected set of factors and parameters is applied to each fund. Based on filings, factors relevant to some funds, (e.g. Credit Default Swaps and Foreign Currencies) have been excluded in the interests of using factors common to most of the funds. As well, we have only allowed for leverage whereas some funds allow for short positions.
[6] The average Predicted R2 value for the six funds is 86%. Beyond fit, Predicted R2 is a measure of our confidence in the predictive value of the analysis. The two funds with the lowest values, and therefore degree of confidence are the Salient and RPG funds, both of which have missing factors unique to each fund, according to filings.
[7] Individual exposure estimates are aggregated into the three typical “risk baskets” considered by Risk Parity funds, with the Inflation basket split between Commodities and TIPS due to their vastly different behavior. Each of these baskets comprises a number of underlying factors.
[8] Implicit leverage does not necessarily represent a literal degree of leverage. It is one indication of the relative ‘riskiness’ of the funds, and can be interpreted as the degree of leverage which would have needed to be applied to most closely replicate each fund’s behavior with the factors used in the analysis. Actual leverage may be greater or less than that implied by the replicating portfolio.
[9] RPG, with most of its exposure attributed to Global Equities, has been removed from this chart in order to prevent rescaling that would hide the dynamics of the other six funds.

[DE Shaw] For Sale: 20% Stake in Hedge Fund. Terms: Complicated.


One of the prime assets that the estate of the bankrupt
 Lehman Brothers still has to sell is a 20 percent stake in the $22 billion hedge fund D. E. Shaw. But so far, Lehman has found no takers.It should be an easy sell.
Over the last six months, the Lehman estate has been trying to drum up interest in the stake, which the Wall Street bank bought a year before it collapsed. But few investment firms solicited by the Goldman Sachs bankers who are shopping it have shown much interest in what is one of the industry’s more successful trading firms.
The main stumbling block is not the price — Lehman wants $550 million to $800 million for the stake, according to people briefed on the matter, including some who considered bidding on it. Rather, it is the terms of ownership that were negotiated by Lehman in the spring of 2007, these people said.
The deal with D. E. Shaw treats Lehman as a passive owner that collects a percentage of the firm’s profits but has no board seat. The fund’s consent is required to sell the stake, according to filings in the bankruptcy proceeding.
Before the financial crisis, these terms were not unusual. Morgan Stanley, for instance, is said to have negotiated a similar arrangement for its 20 percent stake in the Avenue Capital Group, the $14 billion hedge fund founded by Marc Lasry and his sister, Sonia Gardner. In 2006, Morgan Stanley also bought a 19.8 percent stake in Lansdowne Partners, a London hedge fund co-founded by Steve Heinz.
These passive ownership deals negotiated by Wall Street banks were often motivated by a desire to build a long-term relationship with the hedge fund in case the firm ever went public — something that a number of hedge funds were considering before the financial crisis hit.
Today, however, few hedge funds talk about going public. Deals negotiated before the crisis are now seen as too restrictive to attract buyers who are looking for some say in how a firm operates — or seeking more favorable income-sharing arrangements — in return for their investment.
One hedge fund manager with knowledge of the arrangements who spoke on condition of anonymity, said precrisis deals assumed a higher valuation than many of the funds were now worth. The manager said those deals assumed that a hedge fund was worth 15 times as much as its revenue. Now, a single-digit multiple is more realistic.
And firms like D. E. Shaw, which manages $32 billion across all its investment funds, have little incentive to renegotiate the terms of such lucrative deals.
A spokesman for D. E. Shaw declined to comment.
The only firm that continues to show interest in acquiring the stake is the Affiliated Managers Group, an investment firm based in Boston that specializes in buying stakes in hedge funds and private equity firms. But no deal with Affiliated Managers, which owns minority stakes in the hedge fund BlueMountain Capital Management and the private equity firm EIG Global EnergyPartners, is imminent, people briefed on the matter said.
Other investment firms approached by Goldman about buying the Lehman stake include the Blackstone Group and Dyal Capital Partners, a private equity unit of the Neuberger Berman Group.
Officials with Goldman, Blackstone, Dyal Capital Partners and Affiliated Managers all declined to discuss the bidding process.
Matthew Cantor, the general counsel for Lehman Brothers Holdings, which manages the remaining assets of the former investment bank, did not return phone calls seeking comment.
In 2007, Lehman paid around $800 million and a contingency based on future performance for the hedge fund stake. The deal was structured to require Lehman to make a big upfront payment and additional payments in 2009 and 2012. In a regulatory filing at the end of 2013, Lehman gave a value of $675 million for ARS Holdings II, the entity that controls the D. E. Shaw investment.
The hedge fund firm, founded by David E. Shaw, is known for its quantitative trading strategies and for having once employedLawrence H. Summers, who later became President Obama’s top economic policy adviser. (Mr. Shaw has stepped down from an active role in the operation of the firm and is now its chief scientist.)
Its funds have made better-than-average returns over the last several years, after a lackluster performance in 2010. The firm responded to its 2010 results by reducing the fees it had charged investors. In 2011, D. E. Shaw cut its asset management fee to 2.5 percent from 3 percent and cut the performance fee it charges most investors to 25 percent from 30 percent.
Since then, the firm’s performance has mainly outperformed the rest of the $2.7 trillion hedge fund industry. This year, D. E. Shaw’s flagship multistrategy fund — called the Composite Fund — was up 4.2 percent in the first quarter, according to a person knowledgeable about the numbers, which are not reported publicly. This compares with a 1.1 percent gain across the Hedge Fund Research Index, one of the broadest performance gauges in the industry. Last year, the Composite Fund returned about 11 percent, compared with a 9.3 percent return for the entire industry.
The Lehman estate does not appear to be under any deadline to make a deal. To keep the investment in place and prevent Lehman from defaulting on the terms of the original deal, Judge James Peck of the United States Bankruptcy Court in Manhattan approved a payment of $134 million to D. E. Shaw in 2009.
More broadly, the corporate debt of Lehman has proved to be a good investment for hedge funds like Paulson & Company and other investors who bought the bonds at distressed prices after the firm filed for bankruptcy in September 2008. The bonds have since risen in value as Lehman has proved more capable in selling assets and collecting on claims. This year, John Paulson told his investors that Lehman was an investment that “keeps on giving.”
The D. E. Shaw stake, though, is shaping up as something of a waiting game.
As one interested bidder who walked away from the deal, speaking on condition of anonymity, said: “You don’t want to be wearing someone else’s underwear.”
A version of this article appears in print on 05/22/2014, on page B3 of th

Monday, May 19, 2014

S&P 500 Rolling 10-Year Returns


Below is a chart we update from time to time showing the rolling 10-year price change for the S&P 500 going back to the start of the index in 1928.  As shown, over the last ten years, the S&P 500 is up 64.8%.  This might seem like a lot, but compared to past runs for the index, it barely shows up.  Since 1937, the average rolling 10-year return for the S&P has been 103%, so the current 10-year gain of 64.8% is only two-thirds of the average.  

Friday, May 16, 2014

GUNDLACH: We Could Be On The Verge Of 'One Of The Biggest Short-Covering Scrambles Of All Time'

DoubleLine Funds' Jeffrey Gundlach warns that we may be on the edge of a big bond market rally that could see yields tanking.

"If we go down [more] on Treasury yields, we will see one of the biggest short-covering scrambles of all time," said Gundlach on Wednesday in San Diego. This quote is being reported by FA Mag's Dan Jamieson from the Altegris Investments strategic investment conference.
Coming into 2014, almost no one predicted the 10-year Treasury yield would tumble to the levels we're seeing today.
But bond fund manager Jeff Gundlach did.
During a public webcast on Jan. 14, when the 10-year yield was at around 3.0% and Wall Street said it would climb to 3.4%, Gundlach predicted that it could fall as low as 2.5% in the near-term.
Today, the 10-year yield fell through 2.5% and got as low as 2.4716%.
Gundlach isn't the only one warning of a short squeeze in the bond market.
"10y short interest futures (CFTC) data showing a very crowded short," said Stifel Nicolaus' Dave Lutz. "The crowd is rarely right, and now the squeeze is on."
Should things intensify, Gundlach's already contrarian prediction may not have been contrarian enough.
"If for some reason someone has to cover these shorts, you could actually see the low yields of 2012 get taken out," said Gundlach.
gundlach rate prediction

Wednesday, May 14, 2014

ValueAct Steps Down From Valeant Board, To Trim Position


ValueAct Capital filed an amended 13D with the SEC regarding their position in Valeant Pharmaceuticals (VRX).  Per the filing, they note that Mason Morfit will be stepping down from the board of directors.

The key takeaway here is that ValueAct says they're doing this in order to trim their position size because they have a "practice of reducing portfolio weightings in companies where we no longer serve on the board of directors."

Their current stake is valued at approximately $2.5 billion and the letter specifically references that they'd like to still maintain "more than $1 billion in shares."  As far as the timetable of their sales, the letter hints that they might choose to sell some of their stake "later this year."


Mason Morfit's Letter to Valeant

Here's the full letter of his resignation:

"Dear Mike, 

I am hereby resigning effective today as a director of Valeant Pharmaceuticals International. 

As you know, ValueAct Capital has been a shareholder of Valeant Pharmaceuticals since 2006 and I have been a member of the board of directors since 2007. My team and I are proud to have worked with you and to have been a part of tremendous value creation for all shareholders. As I have told you, after seven years on the board of directors, and with my new position on the board of directors of Microsoft, the time has come for me to reallocate my time to other board work. The company is in an extremely strong position and I feel good about the future of Valeant. 

Due to the company?s strategy, there have been very long periods during which we have not been able to buy and sell shares. Most recently, ValueAct Capital has been restricted from selling any shares in Valeant since June 2013, during which time the stock has risen from $85 to $135. Beginning in February 2014, I expressed to you and the board my desire to manage down this position in our fund (currently approximately $2.5 billion out of our $14 billion in assets under management). By resigning today, with the Allergan transaction in the public domain and with Valeant?s earnings report later this week, this will create an opportunity for ValueAct Capital to sell if we choose (of course depending on stock price) later this year. Serving out the remaining term of my board service, could potentially create additional delays and complications, particularly if Allergan enters into negotiations with Valeant. 

To reiterate, we are making a portfolio management decision, not a decision about Valeant?s fundamental business, future performance or the merits of the Allergan deal.  ValueAct Capital has a practice of reducing portfolio weightings in companies where we no longer serve on the board of directors. We have done this consistently since our inception in 2000. That being said, after my resignation we still plan to be large Valeant shareholders for some time. We currently plan to hold more than $1 billion in shares and Valeant should remain one of our top positions. I wish you, your team and my board colleagues all the best and look forward to many more years of extraordinary performance.  Sincerely,  /s/ G. Mason Morfit"

FPA's Romick hoards cash, sees few opportunities

 There are few opportunities for contrarian investors to make money in the current financial markets, Steven Romick, portfolio manager at First Pacific Advisors, said in a speech on Friday.
Romick, who manages approximately $20 billion in assets, said he has raised cash to approximately 40 percent of his portfolio, or nearly double the 26.4 percent of cash that he has held on average since 1994. Record high corporate profits will likely fall as interest rates and corporate tax rates rise over the next five years, he added.
"We are about as bearish as we've ever been," he told the Bel-Air Next-Generation conference in Los Angeles, a gathering of high-net worth families and their representatives.
Romick, whose FPA Crescent Fund was named Morningstar's 2013 Asset Allocation Manager of the Year, has decreased his position in high-yield bonds to nearly zero as spreads between them and investment-grade bonds have fallen. He has been looking to increase his positions in private businesses, ranging from farmland outside of Phoenix to container ships, assets that have not experienced the same multiple expansion as the overall stock market.
Among his recent equity purchases: aluminum company Alcoa Inc, which he began adding to in the fall. He has been attracted to the company, whose shares are up approximately 25 percent for the year to date, because it has decreased its capacity, he said.
Romick, who has managed FPA Crescent since the fund's inception, is known as a contrarian value investor with a long-term view, who likes to buy what the crowd is selling and vice versa. He looks for stocks and bonds that are undervalued relative to their expected earnings and returns. 

Monday, May 12, 2014

Internet Group Crashes


After losing more than 10% over the last four trading days, the Nasdaq Internet Index is now down 21% from its high in early March.  We wouldn't argue with anyone that wants to call this a crash in the group given the magnitude of the decline over such a short period of time.
Below is a look at our trading range screen for the 30 largest stocks in the Nasdaq Internet Index.  For each stock, the dot represents where it is currently trading in its range, while the tail represents where it was one week ago.  Moves into the green shading are considered oversold.
As you can see, big stocks like Netflix (NFLX), Pandora (P), YY Inc (YY), Yandex (YNDX) and Zillow (Z) are down 15-25% over the last four trading days alone.  Amazon.com (AMZN) is down 11.63% over the last four days, and it's now down 27% year to date.  Keep in mind that most of these companies recently reported better than expected numbers, and we have still seen wholesale liquidation of them.  Longer term, these names are in steep downtrends, which means the path of least resistance remains down.  That being said, they have gotten to extreme oversold levels in the near term, and like we saw earlier this month, they can certainly experience short-term bounces within longer-term downtrends.

No Dividends, Big Problems


The average stock in the Russell 1,000 is down 2.02% since March 5th, which was the date that marked a turning point for the market where the "high growth/no earnings" trade began to unwind.  There are quite a few "high flyers" that are now down 40-60% from their recent highs, but as these stocks have been falling, low growth companies that pay dividends have been holding up well. 
In the Russell 1,000, there are 300 stocks in the index that pay no dividend.  As shown below, these 300 non-dividend payers are down an average of 7.21% since March 5th.  Conversely, the 300 highest yielding stocks in the Russell 1,000 are up an average of 2.11% since March 5th.  Talk about a tale of two markets.

Thursday, May 08, 2014

Long-Short Funds Swell in Size — But That’s Mostly About One Fund

Morningstar’s Josh Charlson has this interesting item on the rising assets of long-short mutual funds — it’s mostly about the big success of MainStay Marketfield fund (MFADX):
One reason for the category’s asset acceleration appears to be the supernova-like asset growth of a single fund – MainStay Marketfield (MFADX). The fund, which has a Morningstar Analyst Rating of Bronze, now consumes more than one third of the assets in the $57 billion long-short equity category. In 2013, it collected $13.4 billion to reach its current assets under management of $21 billion. The fund’s success–and it has unquestionably done well on a performance basis too–not only accounts for a significant portion of the category’s growth but has spurred others to enter the market in hope of riding MainStay Marketfield’s orbit.

Wednesday, May 07, 2014

Jim Grant's Sohn Conference Presentation


In trademark bow tie as always. "No disclaimer, I'm just going with the First Amendment." "Successful investing is having people agree with you - later." IDEA: Gazprom long.  Listed in London.  Owns 17% of the world's gas reserve, the economic instrument of Putin's foreign policy.  HLF without Carl Icahn.  Donald Stirling with a London ticker.  Opposite of TSLA. Well hated, very out of favor. 32% operating margins.  Endless list of reasons to be bearish. Russian government owns 50% of shares.   Then he compares FB's corporate governance, with dual class share structure to Gazprom.   Trades at 2.4x 2014 earnings.  That is after taxes, and "after stealing." Be sure to check out the rest of the presentations from the 2014 Sohn Investment Conference.

Lunch is for wimps

Lunch is for wimps
It's not a question of enough, pal. It's a zero sum game, somebody wins, somebody loses. Money itself isn't lost or made, it's simply transferred from one perception to another.