Wednesday, October 07, 2009

SocGen: China bigger bubble than Japan

Superb analysis out of SocGen analysts this morning. Dylan Grice says the Chinese economy has many similarities to the Japanese economy before it imploded in the 90’s. He cites 8 reasons why the Chinese economy is likely to be an even larger implosion than the Japanese economy:

Studying the lessons from Japan’s lost decade(s) is key for anyone seeking to understand today’s post-bubble world. But a closer reading of Japan’s financial history illuminates today’s China far more. In the early 1980s, on the eve of its financial liberalisation, Japan was the rising power from the East set to overtake the West. Younger and growing rapidly, it was still a decade away from its climactic and catastrophic bubble peak. This is where China is now.

  • Japan’s deflationary experience since its bubble burst haunts policy makers and investors, who are confronted with a bewildering range of theories explaining what has gone wrong and how a similar scenario can or can’t be avoided.
  • But the real cause of Japan’s deflation is probably more demographic than debt-related. If so, maybe we should be more worried about the side-effects of an ongoing stimulus overdose aimed at reviving the dead, rather than fighting a more ordinary bout of flu.
  • Japan has been the first industrial economy to begin demographic contraction. Indeed, thanks to Deng Xiaoping’s 1979 one child policy, China will soon face the same problem.
  • But it is unlikely China will suffer the same immediate fate. In fact, further reflection on the similarities between China and Japan leads one to realise that many of the challenges confronting China today have already been faced by Japan, demography being only one.
  • From the strained currency diplomacy to the accusation of favouring exports over domestic demand, from the Western marvelling at Confucian capitalism to the sense of inevitability about the rising of a great power in the East … all were as true for Japan 30 years ago as they are of China today.
  • And Japan 30 or so years ago might be a more fruitful analogy altogether. There is a clear historic coincidence of manias and geopolitical shifts. In the 1980s, Japan’s developing financial bubble reflected a shifting of the balance of power in its direction.
  • But the geopolitical shift towards China now underway dwarfs that seen in Japan in the 1980s, and probably anything yet seen in the history of the modern world. A commensurately seismic mania would lead to excesses beyond all proportion to the periodic bouts of frothiness seen so far.
  • Japan’s experience also hints at what may be the future catalyst unleashing this frenzy: capital account liberalisation. Financial history is filled with financial liberalisations gone wrong and Japan’s bubble can be traced directly to the removal of controls on international capital flows and banking in the early 1980s. Seeking a larger international role for the renminbi, China is now, albeit tentatively, embarking on a similar path. Full liberalisation, when it occurs, could be the starting gun for the biggest bubble the world has ever seen.

 CHINA WILL BE A BIGGER BUBBLE THAN JAPAN

Source: SocGen

Hedge-Fund Bets On Hyperinflation

Several sources are reporting on hedge fund Hayman Advisors, L.P.'s latest letter to its clients (via The Pragmatic Capitalist), explaining its latest investment strategy. The hedge fund received attention for having made a killing as the housing bubble popped by betting against subprime mortgages in 2007. As a result, many now heed its managers' economic views. Their latest prediction is somewhat controversial: the U.S. may experience hyperinflation.

Let me take a step back. Many people think that inflation will follow the massive government stimulus (both fiscal and monetary) that responded to the recession and financial crisis. That's not notable. But hyperinflation is a sort of extreme doomsday scenario. That would mean inflation in the ballpark of 30% per year -- at least. Generally hyperinflation is measured by the month or day, not year, because the numbers are so high.

This section from the letter describes the quantitative basis for the hyperinflation worry:

There have been 28 episodes of hyperinflation of national economies in the 20th century, with 20 occurring after 1980. Peter Bernholz (Professor Emeritus of Economics in the Center for Economics and Business (WWZ) at the University of Basel, Switzerland) has spent his career examining the intertwined worlds of politics and economics with special attention given to money. In his most recent book, Monetary Regimes and Inflation: History, Economic and Political Relationships, Bernholz analyzes the 12 largest episodes of hyperinflations - all of which were caused by financing huge public budget deficits through money creation. His conclusion: the tipping point for hyperinflation occurs when the government's deficit exceed 40% of its expenditures.


According to the current Office of Management and Budget ("OMB") projections, US federal expenditures are projected to be $3.653 trillion in FY 2009 and $3.766 trillion in FY 2010 with unified deficits of $1.580 trillion and $1.502 trillion, respectively. These projections imply that the US will run deficits equal to 43.3% and 39.9% of expenditures in 2009 and 2010, respectively. To put it simply, roughly 40% of what our government is spending has to be borrowed. One has to ask whether the US reached the critical tipping point?

This is an interesting point, because it's a hyperinflation argument that doesn't seem wacky -- it's rooted in historical observation. And it also has nothing to do with the massive monetary stimulus by the Federal Reserve, which could cause additional inflationary pressures. So even if you believe that the Fed can control their side of the equation, the government spending might still cause inflation to get out of hand, according to the logic presented above.

I remain skeptical, mostly because the U.S. has a more robust, developed and sophisticated economy than most places where hyperinflation has occurred. I find it very hard to believe that fiscal and monetary policy wouldn't be seriously altered to avoid incredible levels of inflation if the U.S. found itself facing such a predicament. Still, successfully keeping inflation as low as it has been in recent years seems unlikely.

So what's the fund management's strategy? They're investing in mortgages and high-yield debt. That combination accounts for 75% of their portfolio. If inflation increases substantially, then debt will be easier for borrowers to keep up with, making the high yields those types of debt provide safer than they would otherwise be. Rising interest rates, the presumed response to significant inflation, would also make refinancing of this debt less likely. They appear to be a bit bearish on the stock market, but also note that they have positions in precious metals and natural resources -- other good bets if you expect inflation.

They're shifting their investment to this mix immediately, rather than later. Given the magnitude of the stimulus, they think inflation will start soon -- not 18 to 24 months after stimulus, what they say is the traditional amount of time it takes. Due to the state of the economy and the possibility of prolonged low growth, I find it hard to believe that price levels will start increasing immediately, however. If we get bad inflation, I would be quite surprised to see it happen much before 2011.

Whether you buy into the fund's logic or not, its letter is an interesting one. It also provides analysis on China and Japan. If you have some time to kill and interest, you might want to give it a read.

Tuesday, October 06, 2009

Price of Gold in Dollars (Record High), Euros (-10%), and Yen (-10%)

The price of gold closed at record highs today exceeding $1,040 per ounce throughout the day. While gold is at record highs in dollar terms, the commodity is still down 10% from its highs when priced in Euros and Yen. As shown in the charts, the price of gold is up considerably over the last five years, but the recent run has only been strong in dollar terms. This indicates that the strength is solely a function of a weaker dollar rather than any real pickup demand.

Gold USD

Gold Euros

Gold Yen

Tuesday, September 29, 2009

Emerging market bonds roar

Last week we took a look at the stunning rally in corporate bonds. Now lets take a look at Emerging Market bonds. FT Alphaville reports the large flows coming into the asset class:

Investors poured $727m into emerging market bond funds during the week to September 23, the equivalent of 1.3 per cent of these funds’ total assets and the highest inflow since February 2006, EPFR data show.

Global and US bond funds posted their biggest inflows since early 2001, when EPFR first started tracking them.

Funds dedicated to emerging market equities attracted $2.1bn, a 39-week high, which brought the tally for 2009 to $18.2bn. Funds targeted at investments in Europe, the Middle East and Africa attracted $208m; LatAm funds drew $241m and funds targeted at Asia (excluding Japan) attracted $427m.
These flows have resulted in spreads coming in by more than 400 bps since the end of the year, propelling the asset class up more than 30% year to date.

Monday, September 21, 2009

From Bear to Bull

James Grant argues the latest gloomy forecasts ignore an important lesson of history: The deeper the slump, the zippier the recovery.

[Cover_Main] Mick Coulas

As if they really knew, leading economists predict that recovery from our Great Recession will be plodding, gray and jobless. But they don't know, and can't. The future is unfathomable.

Not famously a glass half-full kind of fellow, I am about to propose that the recovery will be a bit of a barn burner. Not that I can really know, either, the future being what it is. However, though I can't predict, I can guess. No, not "guess." Let us say infer.

The very best investors don't even try to forecast the future. Rather, they seize such opportunities as the present affords them. Henry Singleton, chief executive officer of Teledyne Inc. from the 1960s through the 1980s, was one of these enlightened opportunists. The best plan, he believed, was no plan. Better to approach an uncertain world with an open mind. "I know a lot of people have very strong and definite plans that they've worked out on all kinds of things," Singleton once remarked at a Teledyne annual meeting, "but we're subject to a tremendous number of outside influences and the vast majority of them cannot be predicted. So my idea is to stay flexible." Then how many influences, outside and inside, must bear on the U.S. economy?

Though we can't see into the future, we can observe how people are preparing to meet it. Depleted inventories, bloated jobless rolls and rock-bottom interest rates suggest that people are preparing for to meet it from the inside of a bomb shelter.

Matt Collins

The Great Recession destroyed confidence as much as it did jobs and wealth. Here was a slump out of central casting. From the peak, inflation-adjusted gross domestic product has fallen by 3.9%. The meek and mild downturns of 1990-91 and 2001 (each, coincidentally, just eight months long, hardly worth the bother), brought losses to the real GDP of just 1.4% and 0.3%, respectively. The recession that sunk its hooks into the U.S. economy in the fourth quarter of 2007 has set unwanted records in such vital statistical categories as manufacturing and trade inventories (the steepest decline since 1949), capacity utilization (lowest since at least 1967) and industrial production (sharpest fall since 1946).

It isn't just every postwar disturbance that sends Citigroup Inc. (founded in 1812) into the arms of the state or has General Electric Co. (triple-A rated from 1956 to just this past March) borrowing under the wing of the Federal Deposit Insurance Corp. Neither does every recession feature zero percent Treasury bill yields, a coast-to-coast bear market in residential real estate or a Federal Reserve balance sheet beginning to resemble that of the Reserve Bank of Zimbabwe. Yet these things have come to pass.

Americans are blessedly out of practice at bearing up under economic adversity. Individuals take their knocks, always, as do companies and communities. But it has been a generation since a business cycle downturn exacted the collective pain that this one has done. Knocked for a loop, we forget a truism. With regard to the recession that precedes the recovery, worse is subsequently better. The deeper the slump, the zippier the recovery. To quote a dissenter from the forecasting consensus, Michael T. Darda, chief economist of MKM Partners, Greenwich, Conn.: "[T]he most important determinant of the strength of an economy recovery is the depth of the downturn that preceded it. There are no exceptions to this rule, including the 1929-1939 period."

Growth snapped back following the depressions of 1893-94, 1907-08, 1920-21 and 1929-33. If ugly downturns made for torpid recoveries, as today's economists suggest, the economic history of this country would have to be rewritten. Amity Shlaes, in her "The Forgotten Man," a history of the Depression, shows what the New Deal failed to achieve in the way of long-term economic stimulus. However, in the first full year of the administration of Franklin D. Roosevelt (and the first full year of recovery from the Great Depression), inflation-adjusted gross national product spurted by 17.3%. Many were caught short. Among his first acts in office, Roosevelt had closed the banks. He had excoriated the bankers, devalued the dollar, called in the people's gold and instituted, through the National Industrial Recovery Act, a program of coerced reflation.

Keystone/Getty Images

President Franklin D. Roosevelt, watched by the secretary of the Treasury, William Woodin, as he signs the Emergency Banking Bill March 17, 1933.

"At the business trough in 1933," Mr. Darda points out, "the unemployment rate stood at 25% (if there had been a 'U6' version of labor underutilization then, it likely would have been about 44% vs. 16.8% today. . . ). At the same time, the consumption share of GDP was above 80% in 1933 and the household savings rate was negative. Yet, in the four years that followed, the economy expanded at a 9.5% annual average rate while the unemployment rate dropped 10.6 percentage points." Not even this mighty leap restored the 27% of 1929 GNP that the Depression had devoured. But the economy's lurch to the upside in the politically inhospitable mid-1930s should serve to blunt the force of the line of argument that the 2009-10 recovery is doomed because private enterprise is no longer practiced in the 50 states.

To the English economist Arthur C. Pigou is credited a bon mot that exactly frames the issue. "The error of optimism dies in the crisis, but in dying it gives birth to an error of pessimism. This new error is born not an infant, but a giant." So it is today. Paul A. Volcker, Warren Buffett, Ben S. Bernanke and economists too numerous to mention are on record talking down the recovery before it fairly gets started. They collectively paint the picture of an economy that got drunk, fell down a flight of stairs, broke a leg and deserves to be lying flat on its back in the hospital contemplating the wages of sin. Among economists polled by Bloomberg News, the median 2010 GDP forecast is for 2.4% growth. It would be a unusually flat rebound from a full-bodied downturn.

Our recession, though a mere inconvenience compared to some of the cyclical snows of yesteryear, does bear comparison with the slump of 1981-82. In the worst quarter of that contraction, the first three months of 1982, real GDP shrank at an annual rate of 6.4%, matching the steepest drop of the current recession, which was registered in the first quarter of 2009. Yet the Reagan recovery, starting in the first quarter of 1983, rushed along at quarterly growth rates (expressed as annual rates of change) over the next six quarters of 5.1%, 9.3%, 8.1%, 8.5%, 8.0% and 7.1%. Not until the third quarter of 1984 did real quarterly GDP growth drop below 5%.

One may observe that Ronald Reagan stood for enterprise, free trade and low taxes, whereas Barack Obama stands for other things. Yet President Obama's economic policies seem almost as far removed from Roosevelt's as they are from Reagan's. (Not for Obama, at least not yet, is a new National Recovery Administration). Certainly, Roosevelt never attempted anything like the fiscal and monetary resuscitation organized over the past 12 months. In the post World War II era, the government has attacked recessions with an average fiscal stimulus of 2.6% of GDP and an average monetary stimulus of 0.3% of GDP, for a combined countercyclical lift of 2.9%. (Fiscal stimulus I define as the cumulative change in the federal budget, monetary stimulus as the cumulative change in the Fed's balance sheet, both measured from the peak of the boom to the trough of the bust.) This time out, the fiscal stimulus is likely to measure 10% of GDP, monetary stimulus 9.5% of GDP, for a combined pick-me-up equivalent to 19.5% of GDP. Our Great Recession would be marked for greatness if for no other reason than by the outpouring of federal dollars to repress it.

Congressional Quarterly/Getty Images

Berkshire Hathaway Chairman and CEO Warren Buffett during a hearing before the Senate Finance Committee Nov. 14, 2007.

What did we do before Timothy Geithner and Ben Bernanke? In the day, it was the self-regenerative power of markets that lifted us off the rocks. The brutality of the depression of the early 1920s could not have been far from the mind of President Harry S. Truman as he signed into law the 1946 act to make it the government's business to maintain the economy at full employment. That 1920-21 crackup featured a deflationary collapse—wholesale prices plunged by 37%—and, by 21st century lights, a highly unconventional set of government measures to set things right. To meet the downturn, the Fed raised, not lowered, interest rates and Congress balanced the budget—indeed, ran a surplus. Yet the depression ended. How, exactly, did it end? Falling prices opened wallets, the monetary historian Allan H. Meltzer explains. Finding bargains, consumers and investors snapped them up. "The fall in market prices raised the public's stock of real [money] balances above the desired amount, just as if the Federal Reserve had increased base money at a constant price level," Mr. Meltzer relates in his "A History of the Federal Reserve." After falling by 4.4% in 1920 and by 8.7% in 1921, inflation-adjusted GNP shot up by 15.8% in 1922 and by 12.1% in 1923.

Bargain-hunting is the balm of recovery even today, dead set against low prices the Federal Reserve might be. Detroit is a living laboratory in many things, including the so-called real balance effect. As Marshall Mandall, a RE/MAX agent in that city, tells the story, house prices are still falling at the high end of the market, though they have stabilized at the low end. Transaction volumes are rising. Speculators are on the prowl, but so, too, are ordinary home buyers. It seems—who'd have guessed it?—that value sells. "They can buy something for half of what they could three years ago," Mr. Mandall says. "Everybody perceives bargains in their house-hunting." At the end of the second quarter, according to the Detroit Free Press, the supply of unsold houses was equivalent to 8.5 months' sales, down 39% from the year before.

Through the first six months of 2009, the Case-Shiller 10-City Composite index of house prices fell by 5.5% compared to year-end 2008. However, the rate of decline has been slowing and, indeed, the index recorded month-to-month appreciation in May and June. It may just be that the Fed's assumption of a 14% decline in prices this year (built into the base case of its bank stress test) is unrealistically bearish.

The Fed's voice is among the saddest in the lugubrious choir of bearish forecasters, and for good reason. By instigating a debt boom, the Bank of Bernanke (and of his predecessor, Alan Greenspan) was instrumental in causing our troubles. You might have thought that it would therefore see them coming. Not at all. Belatedly grasping how bad was bad, it has thrown the kitchen sink at them. And it maintains this stance of radical ease lest it get the blame for a relapse. However, by driving money market interest rates to zero and by setting all-time American records in money-printing ($1.2 trillion conjured in the past 12 months), the Fed is putting the value of the dollar at risk. Its wide-open policy all but begs our foreign creditors to ask the fatal question, What is the dollar, anyway? Why, the dollar is a scrap of paper, or an electronic impulse, the value of which is anchored by the analytical acuity of the monetary bureaucracy that failed to predict the greatest financial crackup since the 1930s.

Alex Wong/Getty Images

Federal Reserve Chairman Alan Greenspan testifies before the Committee on Banking & Financial Services in Congress Feb. 24, 1998.

The Fed may be worried about something else. By sitting on interest rates, it is distorting every business and investment decision. If mispriced debt was the root cause of the narrowly-averted destruction of global finance, the Fed is well on its way to setting the stage for some distant (let us hope) Act II. In the meantime, ultra-low interest rates have lit a fire under the stock and debt markets.

By rallying, equities and corporate bonds not only anticipate recovery, but they also help to bring it to fruition. By opening their arms wide to such previously unfinanceable businesses as AMR Corp., parent of American Airlines, and Delta Air Lines Inc., the newly confident credit markets are implementing their own stimulus program. "Reflexivity" is the three-dollar word coined by the speculator George Soros to describe the dual effect of market oscillations. Not only does the rise and fall of the averages reflect economic reality, but it also changes it. One year ago, the Wall Street liquidation stopped world commerce in its tracks. Today's bull markets are helping to revive it.

I promised to be bullish , and I am (for once)—bullish on the prospects for unscripted strength in business activity. So, too, is the Economic Cycle Research Institute, New York, which was founded by the late Geoffrey Moore and can trace its intellectual heritage back to the great business-cycle theorist Wesley C. Mitchell. The institute's long leading index of the U.S. economy, along with supporting sub-indices, are making 26-year highs and point to the strongest bounce-back since 1983. A second nonconformist, the previously cited Mr. Darda, notes that the last time a recession ravaged the labor market as badly as this one has, the years were 1957-58 —after which, payrolls climbed by a hefty 4.5% in the first year of an ensuing 24-month expansion. Which is not to say, he cautions, that growth this time will match that pace, only that growth is likely to surprise by its strength, not weakness.

And that is my case, too. The world is positioned for disappointment. But, in economic and financial matters, the world rarely gets what it expects. Pigou had humanity's number. The "error of pessimism" is born the size of a full-grown man—the size of the average adult economist, for example.

James Grant is the editor of Grant's Interest Rate Observer. Among his books is "The Trouble with Prosperity."

Thursday, September 17, 2009

A rare event indeed

A rare event indeed. The guys at Bespoke Investment Group note that the S&P 500 is 20% above its 200 day moving average for the first time since May 1983. Please note the rapid rebound from historically oversold levels earlier this year. Not sure exactly what it means for the market going forward, but worth noting nonetheless.

To Reduce Hedge Fund Risk, Let Everyone In

It is time to get serious about hedge fund risk. This, however, is not the usual argument for more regulation of hedge funds. Here is a contrarian view: the best course for our capital markets may actually be in the other direction. Perhaps hedge funds need to be deregulated, breaking down the wall that restricts hedge fund investing only to the wealthy.

All investors — not just rich ones — should have access to the superior investing and diversification potential of hedge funds. Deregulating these opaque entities will also bring these funds out into the open, helping regulators monitor systemic risk, where the real focus of hedge fund supervision should be.

What do I mean? Right now, hedge funds are walled off from the public by the Investment Company Act and rules created by the Securities and Exchange Commission. For the most part, they’re available only to “sophisticated investors,” defined by the S.E.C. as those with more than $1 million in assets or individual income exceeding $200,000 in each of the last two years. The S.E.C. has periodically proposed raising this bar to $2.5 million in assets; hedge funds often lift it even higher, to a net worth of more than $5 million.

This is why I cannot use my Charles Schwab account to buy into a hedge fund. Given the public misunderstanding of what these firms are and do, this is considered a good thing. Common wisdom says that hedge funds are too complicated and risky for Main Street.

This is a myth.

Hedge funds provide important diversification for their investors. They balance other investments and reduce overall risk. For example, the Hedge Fund Research Weighted Composite Index, a measure of aggregate hedge fund returns, rose 14.1 percent this year through August. This was after a negative 19.03 percent return in 2008.

That sounds bad — until you learn that the Standard & Poor’s 500-stock index returned about 13 percent and a negative 38.49 percent for the same respective time periods. Clearly, hedge funds came out ahead.

(Some specific types of hedge funds have done even better: the Hedge Fund Research Multi-Strategy Index, which tracks multi-strategy funds, returned 19 percent for this year through August and negative 20.3 percent last year.)

Hedge funds also provide what the industry calls absolute returns. Mutual funds aim simply to beat their market benchmark, meaning they’ll define themselves as successful if they drop 14 percent while the S.& P. 500 falls 15 percent. By contrast, hedge fund managers are not paid until they generate positive returns — that is, they actually make money.

“But what about the risk?” you might ask.

Hedge funds do more than diversify investment portfolios. They live up to their name: they (ideally) hedge their returns so that they are less volatile. True, some funds have failed. But General Motors went bankrupt, and we’re not about to halt the stock market.

According to Hedge Fund Research, about 16 percent of hedge funds closed last year. That may sound like a lot, but it does not mean that all that capital was wiped out. Even investors in Long-Term Capital Management and Amaranth Advisors, two of the most spectacular hedge fund flameouts, got back 10 percent and 35 percent of their money, respectively.

The overwhelming majority of hedge fund liquidations are orderly runoffs that result in some loss for investors, but not an entire loss of their principal investments. Before the financial crisis, one study found that the majority of hedge fund closures stemmed from operational risk, not investment failure. Funds that did fail because of their investment performance collapsed because of liquidity issues and investor withdrawals.

This does not mean that investors should put all of their money in one hedge fund, just as they shouldn’t invest only in General Motors. But hedge funds are an important part of the diversified investment portfolio that financial experts recommend.

Finally, there is the perceived complexity of hedge funds. Are these firms really more arcane than the complicated investment banks of today like Goldman Sachs? The truth is that public hedge funds are no more complex than many of today’s public companies.

The S.E.C. has tried again and again to restrict public investment in hedge funds, but the problem is that the markets are moving too fast. The financial revolution and demands of investors mean that hedge fund-like products that are being marketed to the general public are being created, legally. Thus, we have the IndexIQ’s Hedge Multi-Strategy Tracker Exchange-Traded Fund. According to IndexIQ, the fund is meant “to replicate, before fees and expenses, the returns of the IQ Hedge Multi-Strategy Index,” which encompasses a variety of hedge fund investment techniques.

If you want to build your own hedge fund, you can now buy other exchange-traded funds or exchange-traded notes for oil, currencies and various commodities. My favorite is the iPath DJ-UBS Coffee Subindex Total Return E.T.N., which tries to replicate an index of coffee future contracts. Pretty complex, no?

Because of another regulatory loophole, the S.E.C. allows the public listing of hedge fund firms like the Fortress Investment Group and Och-Ziff Capital Management — but not the funds they run. Of course, these firms draw their income from these unlistable hedge funds, so an investment in Och-Ziff’s stock is similar to a direct investment in one of its funds. But holding Och-Ziff stock is even riskier than investing in one of its funds, since limited partners can have their capital returned if the fund runs negative returns. Stockholders in the firm in the same situation receive nothing.

The real issue with hedge funds is systemic risk: the possibility of another Long-Term Capital, when one fund almost took down the whole financial system. Regulators must have the tools to prevent this kind of danger.

Having hedge funds report their investments to the S.E.C. (or another regulator) and limiting systemic risk through capital requirements is now before legislators. But making these firms more accessible to average investors would be a natural incentive to bring them further into the light. The market process would help obtain disclosure about their investments. It would also offer an alternative to the roughly $10 trillion mutual fund industry, which all too often fails to beat its benchmark indexes.

Because why shouldn’t public retail investors get the same benefits as private wealthy investors?

Mutual Fund Investors Cling to Safety of Bonds, Missing Stock Rally - Pimco Total Return Fund (PTTAX) Benefits


Talk this week has been that the retail investor has finally returned to the market in the past few days; further a Wall Street Journal article yesterday touted the explosion of volume in retail brokerage companies (Ameritrade, Etrade, et al) due to daytrading / speculation in the Citigroup (C), Fannie Mae (FNM), AIG's (AIG) of the world. So it's not just HAL9000 playing in those corners. Overall, it's like we are all Bobby Ewing.... had a bad dream there for 2 years, and now we're back at October 2007. What happened last year? Don't remember, just was a bad dream.

According to CBSMarketwatch, notwithstanding the factors above, many individuals have been hanging out in bond funds and missing much of the rally. Actually this data is staggering, 90% of new money into mutual funds in 2009 is avoiding equities. This coincides with anecdotal conversations I have had with people the past half year (mostly older than me) who have been burned twice in 1 decade with stocks, and just want to not lose money at this point. If that attitude will change in the future is unknowable, but many have lost so much they just might not have the means to take the risk... especially since they are much closer to retirement now that in the late 90s. Oh well, we don't really need individual investors - as long as the Fed keeps funneling money into our financial oligarchs, who in turn use the money to speculate - it's all good. It is their sandbox after all.
  • Mutual-fund investors still smarting from the beating they took in stocks last year are continuing to pile into the relative safety of bond funds, causing many to miss out on the market's roughly 50% bounce from the March low.
  • Through August, about $226.4 billion flowed into U.S. open-end funds in 2009, Morningstar Inc. said in research released Tuesday. "Fund firms are close to making up the ground lost in the second half of 2008, when investors pulled $251 billion out of mutual funds," the investment researcher said.
  • However, of the year-to-date inflow, about $209.1 billion, or more than 90%, has gone into taxable-bond and municipal-bond funds.
August seemed to mark the return of the retail investor
  • .... in August, when investors put $54 billion into all types of mutual funds. "That represents the largest inflow since February 2007. While that's certainly a positive sign for fund firms, it doesn't necessarily signal renewed enthusiasm for equities," Morningstar said.
But even August's monies still do not seem to be going into equities
  • "As has been the case throughout much of the year, the vast majority of inflows have been to fixed-income funds," it added. "Approximately 60% of August's flows went to taxable-bond funds, and municipal-bond funds made up another 20%."
  • ... fund investors' penchant for fixed income highlights their wariness of the stock rally after the financial meltdown ravaged their retirement plans.
Speaking of financial oligarchs, one of the new breed, PIMCO, is loving this development
  • Bond-fund specialists like Pimco have benefited from investor skittishness. For example, Pimco Total Return Fund, which is run by bond guru Bill Gross, has been the top-selling fund throughout 2009, raking in nearly $5.5 billion of inflows last month alone, according to Morningstar.
Which means 10% of all "net" money going into funds in August went into 1 fund, PIMCO Total Return (PTTAX) - that is simply staggering.
  • The Pimco fund "now holds a 13% share of the taxable-bond mutual fund market and weighs in at a whopping $177.5 billion in net assets," Morningstar said. "At its current size, it is almost twice as large as the next-most-popular fund, Vanguard Total Stock Market Index Fund (VTSMX)
  • The Pimco Total Return Fund was up more than 11% for the year-to-date period through Sept. 14
Somewhere Bill Gross is smiling. [Feb 21, 2009: Fortune - Is PIMCO's Bill Gross too Powerful?] Toss a 0.9% annual expense ratio on $177 billion in assets and you've got some walking around money ...

Wednesday, September 16, 2009

Expect CPI to Turn Up

Year over Year CPI


CPI is beginning to level (and turn) in year over year figures. Looking at the breakdown of CPI, we see transportation costs (mainly fuel) being the driver. As high oil prices begin to fall off the year over year baseline, expect headline CPI to begin moving up, even if core prices continue to move down due to economic weakness.

100% Gainers and Their Estimated P/Es

The average year to date change of stocks in the S&P 500 is 33.27%, even though the index itself is up just 16.54% YTD. The average estimated P/E ratio for next year for stocks that actually have earnings in the index is 19.47. Twenty-six stocks in the S&P 500 are expected to lose money over the next year.

Below we provide a list of S&P 500 stocks that are up more than 100% year to date along with their estimated P/E ratios. As shown, there is a pretty wide variation in valuations of the best performing stocks year to date, with some having low P/Es and some having high or negative P/Es. Micron (MU), Advanced Micro (AMD), Sun Micro (JAVA), Sprint (S), and Office Depot (ODP) are the five stocks up more than 100% in 2009 with negative estimated P/Es. Other strong performing stocks with high valuations include THC, F, SNDK, MOT, and MWV. XL Capital has the lowest P/E estimate of the stocks listed below at 7.40. It is up 370% year to date. Genworth (GNW) is up 325% with a P/E estimate of 11.06, and WDC is up 218% with a P/E estimate of 9.76. Other stocks on the list with a ratio below 20 include FCX, GT, EXPE, WYN, MEE, JWN, GS, CTSH, and LIFE.

Bestpe

Tuesday, September 15, 2009

Thursday, September 10, 2009

Gold Reverse Head and Shoulders

While Barrick Gold's (ABX) decision to eliminate all of its hedges on the price of gold may end up marking a short-term top in the price of the commodity, technicians would argue that the company's decision was a good one. As shown below, the price of gold is in the late stages of a reverse head and shoulders pattern. If this is the case, and the commodity can finally decisively break its neckline level of $1,000, this pattern would imply a price target of $1,300 for the metal.

Gold091009

Tuesday, September 08, 2009

Thursday, September 03, 2009

Gold is a lousy inflation hedge


Maybe gold isn't the hedge you think it is. Hong Kong research firm GaveKal clearly thinks so.

FT: "We have long argued that gold is actually a lousy inflation hedge, but a reasonable hedge against a financial meltdown. Perhaps the upcoming anniversary of the Lehman bankruptcy is making the market a bit edgy-with financial stocks selling down hard recently, and with rumors floating through the market of a pending bank or hedge-fund collapse. Such fears may explain why gold is rising even as the other popular “inflation plays”, such as oil, are falling."

Thus gold to them is protection against financial meltdown, not inflation. Yet financial meltdown may now be the wrong issue to hedge against.

While current momentum may favor gold due to gold-fund demand, they think China and other countries will never dump the dollar any time soon. The US is too important an economy to the world.

Goldbugs take note.

Saturday, August 29, 2009

Percent of Stocks Above Their 200ma's Hitting Extreme Levels

Some extreme readings are appearing in a few Worden Bros. indicators that look at stocks relative to their 200 day moving averages. One is T2107, which simply looks at the percentage of stocks trading above their 200ma. The other is T2109, which looks at the percentage of stocks trading at least 1 standard deviation above their 200ma. Both indicators are near all time highs (dating back to 1986). In fact, the only period of time in which these indicators registered higher readings was in the beginning of 2004. Below is a chart of T2107 which illustrates this:


This demonstrates just how extreme the current move is in terms of breadth. Also interesting about the chart is that we aren’t that far removed time-wise from extremely low readings. Extreme overbought doesn’t necessarily mean a decline is about to begin. In fact the last time these levels were reached in 2004, the market continued to trudge higher for about 2 ½ months before finally beginning a meaningful correction.

Four Stages of Secular Bear Markets

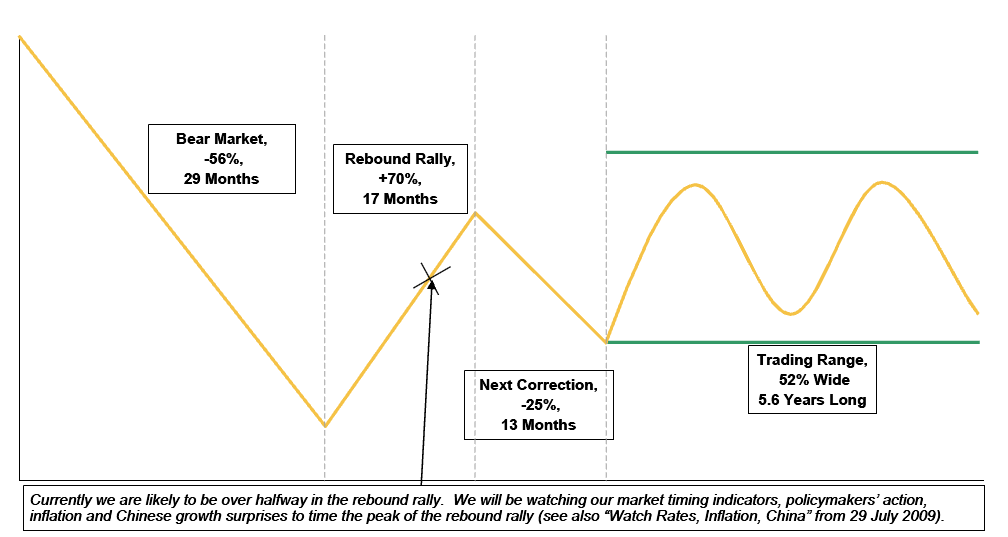
This fascinating composite chart below is courtesy of the Strategy desk of Morgan Stanley Europe. It shows what the average of the past 19 major Bear markets globally have looked like:

>

Typical Secular Bear Market and Its Aftermath

secular-bear-markets

>

The Chart represents typical secular bear markets based on MS’s sample of 19 such bear markets as shown after the jump.

There are obvious differences and similarities — the SPX fell 43% over 18 months, and snapped back 50% in 6 months. Almost but not quite as deep, but much faster a fall. What that means for the snapback is anyone’s guess.

There is no guarantee that the current market will track that amalgam, knowing what a composite of past Bears looks like can be helpful to your understanding of what is typical.

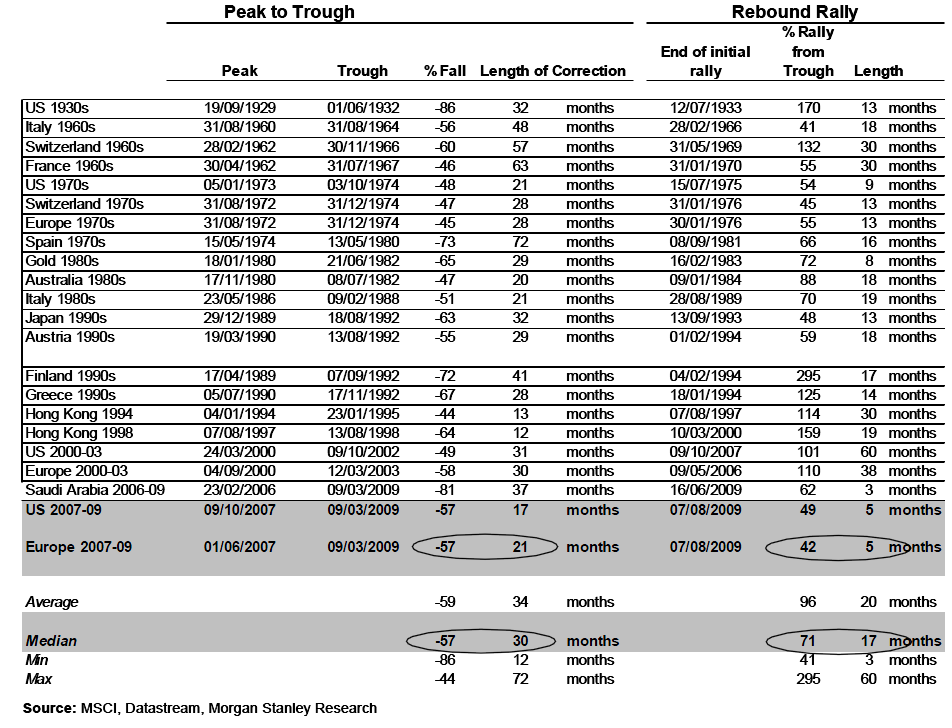
This table shows Secular Bear Markets and Subsequent Rebound Rally:

>

secular-bear-rebound

>

Source:
The Aftermath of Secular Bear Markets
Authors: Teun Draaisma, Ronan Carr, CFA & Graham Secker, Edmund Ng, CFA and Matthew Garman
Morgan Stanley European Strategy 10 August 2009

Monday, August 24, 2009

Trend following?

Some equations do work. Good hedge fund + rough quarter = buying opportunity. As expected many hedge funds have performed very well so far in 2009. It is no surprise that market dislocations, misvaluations and panic-selling hysteria created fantastic opportunities for the best absolute return managers. Inevitably a repeat of 1998, 1994 and 1970 occurred with so many "experts" saying to avoid hedge funds. Redemptions by some who didn't understand proper strategy diversification benefited those investors who reduced risk by having lots of hedge funds in their portfolios.

Even more impressive are the hedge funds that made money in both 2008 and 2009. Market timing is hard but some have the ability to do it. The best way to evaluate any investment strategy is its return on risk. Even with the recent stock market rally, the return on risk of long only funds has been poor. As usual the mythical equity risk premium hasn't worked. Is it zero? Is it negative? I don't know but it is too unreliable to match institutional liabilities or for individual investors wanting to grow and preserve their retirement savings. Invest with managers that have the skills to MAKE MONEY when things go pear-shaped - ie when markets or economies go bad.


All trends end. Sad how those who argue trend following has no value continue to advocate long only equity funds because of an upward trend that can supposedly be extrapolated far into the future. As the volatility of previous years has shown, it is pear-shaped times that provide the true stress test for risk management. The trend is your friend until it ends. As we saw with stock, credit and commodity markets this decade, the more strong and long lasting the trend, the more violent the end.

Unfortunately the crowd STILL uses normal assumptions which is fine UNTIL things stop being normal. Pear-shaped situations require pear-shaped analysis. I'm not a quant but I've always preferred non-linear pear-shaped equations rather than linear equations since they capture the initial quasi-linear uptrend and then model the volatile end game. WE DON'T KNOW THE FUTURE but we do know there are always securities to short sell and others to buy.

The simplest pear-shaped formula is y^2=x^3-x^4 which only has solutions in the real world for inputs between 0 and 1. We can define the beginning of anything at zero and ending at one. Identifying and jumping onto a trend is relatively easy. Lots of people make money in bull markets. But knowing when to get out and reverse into a short position is what separates the alpha players from the beta repackagers. Since most phenomena are non-linear it stands to reason that linear models are of limited use.

Many physical processes exhibit pear-shaped characteristics. The universe is pear-shaped. Time is certainly pear-shaped. Just ask Stephen Hawking. Atoms are too. If the largest and smallest systems are pear-shaped, it would seem possible that finance could also exhibit a similar form. Bonds and loans are great assets till the borrower defaults. Mortgages are fine unless real estate goes pear-shaped. Bull markets last longer and have low volatility while bear markets are quicker but often eviserate years of "gains" from the prior bull market.

Recently I reread a couple of books on the economic shape of the world. One was The
World is Flat
by Thomas Friedman. While interesting, the premise is incomplete. The world is actually pear-shaped and only gives the ILLUSION of flatness during the easy times. Perhaps I should write a book called The World is Pear-Shaped. Nascent protectionism may be slowing the globalization trend. David Smick's The
World is Curved
is insightful and we need techniques to prepare for the different scenarios beyond the curve.

Most economists and "passive" index fund groupies sell a rosy view of a future that we can apparently look forward to. I hope they are right but CONSISTENT CAPITAL GROWTH requires mitigating the downside. Few investors can afford to ignore drawdowns or volatility. Follow the trend? Into the abyss? Many equities drop to zero but NONE has ever gone to infinity.

The life-cycle for businesses shortens all the time. Corporate and even country hegemony is not as long term as it used to be. Typewriters, sliderules and vinyl records all had rising sales for decades but not much "growth" recently as demand went pear-shaped. Innovative strategies that seep into the public domain and crowded trades are prone to end with a meltdown. Bubbles take a long time to form but a short time to end. The best alpha generators are those managers equipped to successfully navigate difficult markets. Successful trend following requires good trade entries AND exits. Invention eliminates the obsolete.

Some absolute return strategies went pear-shaped last year like CB arbitrage and long/short equity. The returns have stormed back this year by those managers with the skills to achieve them. Meanwhile good managed futures CTAs and short biased funds continue to deliver ESSENTIAL negative correlation to their clients. Portfolios need to be structured for ANY possibility including a dystopian long term. Fiduciary duty REQUIRES portfolio construction for pessimistic scenarios. Bear markets or bull markets are irrelevant in robust strategy allocation.

51.68% In 165 Days

The S&P 500 is now up 51.68% in the 165 calendar days since its March 9th closing low. Below we highlight all "official" bull markets for the S&P 500 since 1927 (a rally of at least 20% that was preceded by a decline of at least 20% is considered a bull market).

Many bears believe the recent gains are just a rally within a longer-term downtrend. But the argument that we'll eventually head lower than the March lows is becoming a harder and harder sell. One argument the bears use is that we saw a number of similar bear market rallies that were this extreme during the overall 86% decline that the market saw from September 1929 to June 1932. However, as shown in the table below, the current rally is now bigger and longer than any of the rallies seen during the 1929 to 1932 crash. The biggest rally during the '29 to '32 period was 46.77% over 148 days. The current rally is up 51.68% over 165 calendar days.

Histbulls

Spx32

Wednesday, August 19, 2009

Bear Season in China

For the fourth time in six days, China's Shanghai Composite finished down more than 2.5%. On an intraday basis, the index is down 20.6% from its high just over two weeks ago. On a closing basis, the Shanghai Composite is down 19.9%, which is dangerously close to the 20% threshold for a bear market.

Shanghai 2009

WHAT IS DOCTOR COPPER TELLING US?

Copper is no doubt one of the most economically sensitive commodities in the world. Many investors even say the metal has a PhD because of its predictive value. The current rally in copper has been incredibly strong. So strong, in fact, that it makes me question my secular bear market thesis. Of course, it’s important to note that the Chinese stimulus plan has had a huge impact on the price of copper and will likely continue to influence prices in the coming quarters. As for now, the price surge has to be taken as an enormous vote of confidence in economic activity going forward. In the near-term, however, copper is already 5% off its highs and continues to struggle in today’s market. The low volume rally in stocks is not being confirmed by copper which is currently trading flat on the session.

 WHAT IS DOCTOR COPPER TELLING US?

The "Real" (Inflation Adjusted) Mega-Bear Markets

Road to Recovery?

Buffett Op-Ed: The Greenback Effect

August 19, 2009

Omaha

IN nature, every action has consequences, a phenomenon called the butterfly effect. These consequences, moreover, are not necessarily proportional. For example, doubling the carbon dioxide we belch into the atmosphere may far more than double the subsequent problems for society. Realizing this, the world properly worries about greenhouse emissions.

The butterfly effect reaches into the financial world as well. Here, the United States is spewing a potentially damaging substance into our economy — greenback emissions.

To be sure, we’ve been doing this for a reason I resoundingly applaud. Last fall, our financial system stood on the brink of a collapse that threatened a depression. The crisis required our government to display wisdom, courage and decisiveness. Fortunately, the Federal Reserve and key economic officials in both the Bush and Obama administrations responded more than ably to the need.

They made mistakes, of course. How could it have been otherwise when supposedly indestructible pillars of our economic structure were tumbling all around them? A meltdown, though, was avoided, with a gusher of federal money playing an essential role in the rescue.

The United States economy is now out of the emergency room and appears to be on a slow path to recovery. But enormous dosages of monetary medicine continue to be administered and, before long, we will need to deal with their side effects. For now, most of those effects are invisible and could indeed remain latent for a long time. Still, their threat may be as ominous as that posed by the financial crisis itself.

To understand this threat, we need to look at where we stand historically. If we leave aside the war-impacted years of 1942 to 1946, the largest annual deficit the United States has incurred since 1920 was 6 percent of gross domestic product. This fiscal year, though, the deficit will rise to about 13 percent of G.D.P., more than twice the non-wartime record. In dollars, that equates to a staggering $1.8 trillion. Fiscally, we are in uncharted territory.

Because of this gigantic deficit, our country’s “net debt” (that is, the amount held publicly) is mushrooming. During this fiscal year, it will increase more than one percentage point per month, climbing to about 56 percent of G.D.P. from 41 percent. Admittedly, other countries, like Japan and Italy, have far higher ratios and no one can know the precise level of net debt to G.D.P. at which the United States will lose its reputation for financial integrity. But a few more years like this one and we will find out.

An increase in federal debt can be financed in three ways: borrowing from foreigners, borrowing from our own citizens or, through a roundabout process, printing money. Let’s look at the prospects for each individually — and in combination.

The current account deficit — dollars that we force-feed to the rest of the world and that must then be invested — will be $400 billion or so this year. Assume, in a relatively benign scenario, that all of this is directed by the recipients — China leads the list — to purchases of United States debt. Never mind that this all-Treasuries allocation is no sure thing: some countries may decide that purchasing American stocks, real estate or entire companies makes more sense than soaking up dollar-denominated bonds. Rumblings to that effect have recently increased.

Then take the second element of the scenario — borrowing from our own citizens. Assume that Americans save $500 billion, far above what they’ve saved recently but perhaps consistent with the changing national mood. Finally, assume that these citizens opt to put all their savings into United States Treasuries (partly through intermediaries like banks).

Even with these heroic assumptions, the Treasury will be obliged to find another $900 billion to finance the remainder of the $1.8 trillion of debt it is issuing. Washington’s printing presses will need to work overtime.

Slowing them down will require extraordinary political will. With government expenditures now running 185 percent of receipts, truly major changes in both taxes and outlays will be required. A revived economy can’t come close to bridging that sort of gap.

Legislators will correctly perceive that either raising taxes or cutting expenditures will threaten their re-election. To avoid this fate, they can opt for high rates of inflation, which never require a recorded vote and cannot be attributed to a specific action that any elected official takes. In fact, John Maynard Keynes long ago laid out a road map for political survival amid an economic disaster of just this sort: “By a continuing process of inflation, governments can confiscate, secretly and unobserved, an important part of the wealth of their citizens.... The process engages all the hidden forces of economic law on the side of destruction, and does it in a manner which not one man in a million is able to diagnose.”

I want to emphasize that there is nothing evil or destructive in an increase in debt that is proportional to an increase in income or assets. As the resources of individuals, corporations and countries grow, each can handle more debt. The United States remains by far the most prosperous country on earth, and its debt-carrying capacity will grow in the future just as it has in the past.

But it was a wise man who said, “All I want to know is where I’m going to die so I’ll never go there.” We don’t want our country to evolve into the banana-republic economy described by Keynes.

Our immediate problem is to get our country back on its feet and flourishing — “whatever it takes” still makes sense. Once recovery is gained, however, Congress must end the rise in the debt-to-G.D.P. ratio and keep our growth in obligations in line with our growth in resources.

Unchecked carbon emissions will likely cause icebergs to melt. Unchecked greenback emissions will certainly cause the purchasing power of currency to melt. The dollar’s destiny lies with Congress.

Warren E. Buffett is the chief executive of Berkshire Hathaway, a diversified holding company.

Monday, August 17, 2009

Money Market Funds Yielding Nada... In Other Words "Solid" Real Returns

USA Today reports on the (lack of) returns in money market space:

Money isn't everything, at least to investors in money market funds. Yields are at all-time lows, and nearly a quarter of funds yield nothing at all.

The average money fund yielded an annualized 0.08% the week ended Aug. 4, the latest data from iMoneyNet, which tracks funds, show. At that rate, a $10,000 investment would return 15 cents a week. But 275 taxable funds have no yield, 23% of the 1,180 funds iMoneyNet tracks.
With that as a background, this won't surprise you. Over the past twelve months, the Lipper Money Market Index has returned 1.01% (higher than 0.08%, but minuscule none-the-less).

However, this may. Over that same period, inflation (as measured by CPI) has DECREASED 2.1% year over year, which has resulted in real returns in money market space (i.e. returns less inflation OR importantly returns + deflation) up more than 3%.


With the economy shrinking and expected by many to grow at 2-3% when it does rebound (in real terms), 3% real returns don't seem so bad.

Source: Lipper / BLS

S&P 500 P/E Ratio Nearly Doubles

A P/E ratio rising from 10 to 18.35 is what happens when the S&P 500 rallies 50% (the P) while earnings (E) continue to decline. Below we provide a chart of the S&P 500 price to earnings ratio since the start of the 2002 bull market using trailing 12-month diluted earnings per share from continuing operations.

The S&P's P/E ratio reached its highest level since the end of 2004 earlier this week. While P/E expansion is not unusual during bull markets, investors will remember that the S&P 500's P/E actually declined from the start to the finish of the '02-'07 bull. This is because earnings grew even faster than stock prices. When looking at the chart below, you can see that the P/E did expand in the early days of the '02-'07 bull before earnings finally started to grow again in late 2003 and early 2004. Obviously if the current bull is going to have any sustainability at all, earnings will have to start growing again. But for now, as evidenced by the skyrocketing P/E ratio, investors are paying up on the hopes of future earnings growth.

Spxpe814

Monday, August 10, 2009

Being prepared: PIMCO guarding against fat-tail events

PIMCO is using tail-risk hedging to guard against catastrophic events like the current financial crisis — a method that has allowed the company to take advantage of market weaknesses instead of succumbing to them.

Insuring against such events has helped returns for PIMCO's target-date funds and now the company is looking to expand this approach to other strategies.

Vineer Bhansali, managing director and head of analytics for portfolio management at Pacific Investment Management Co. LLC, Newport Beach, Calif., was instrumental in developing the firm's original fat-tail strategy as part of what he calls “offensive risk management.”

“Typically you think of spending money for insurance as a cost, but if you think of the performance of an investment portfolio in three or five or 10 years, you should expect to have the portfolio impacted by a fat-tail event, and having that cheap tail hedge can make the difference between surviving and having to liquidate,” Mr. Bhansali said.

The emphasis for PIMCO is not so much on anticipating the probability of a catastrophic event, but preparing for the severity of it — what Mr. Bhansali calls “just-in-case” insurance.

“When everyone sees the hurricane, you can't sell the house because everyone is trying to do the same thing,” he explained

The key to tail-risk hedging is knowing where to look. Mr. Bhansali describes it this way: “One market gets dislocated and then you have a blowout and the solution to that problem creates opportunity for cheap hedges.”

Until recently, PIMCO had been hedging liquidity risk. Today, it is hedging against the possibility of inflation.

“Inflation insurance is very cheap right now,” Mr. Bhansali said.

So far, the company has applied tail-risk hedging to its Global Multi-Asset Fund, a nine-month-old fund that Mr. Bhansali manages with PIMCO co-CEO and co-Chief Investment Officer Mohamed El-Erian and Managing Director Curtis Mewbourne, as well as its RealRetirement target-date funds.

PIMCO officials also expect to implement the strategy in portfolios where the hedges might be appropriate. PIMCO's positions in tail-risk hedged portfolios are slightly less than $9 billion in total notional value. The company manages $840 billion in assets.

Tail-risk hedging focuses on the far left end — or tail — of the probability distribution curve of investment returns. The simplest way to hedge is to not buy risky securities to begin with, Mr. Bhansali said. Barring that, portfolio managers look to invest in negatively correlated or uncorrelated securities on the tail, like U.S. Treasuries. They also seek out the cheapest instruments to buy, which may not be available in the exact markets they want to hedge but in cross markets, including equity options, bond options, currency options, inflation options, credit default swap indexes and index tranches.

Investors who use PIMCO's fat-tail strategy can end up paying 50 to 100 basis points for the underlying hedges, a costly price tag but one that Mr. Bhansali argues is worthwhile. Mr. Bhansali acknowledged that institutional investors have shown some initial reluctance to the approach, some of them reasoning that if they don't like the risks, they won't invest in them, so why bother with insurance?

“We're making significant headway but it's an interesting battle in certain areas,” he said.

Cynthia F. Steer, chief research strategist and head of beta research group at consulting firm Rogerscasey Inc., Darien, Conn., said the staffs of pension funds, foundations and endowments are still studying tail-risk hedging before making recommendations to their respective boards.

“It's still early days,” she said.

Nonetheless, she sees the strategy as a realistic option for institutional investors.

“We're in an era when we have to put risk in the portfolios as well as know when to take risk out of the portfolios,” Ms. Steer said.

She added that the likely early implementers of tail-risk hedging will be corporate defined benefit plans, followed by endowments and foundations in the next 12 to 15 months.

Erik Knutzen, CIO of NEPC LLC, Boston, said plan sponsors who are at risk of experiencing a liquidity crunch, where they would be forced sellers of assets at distressed prices, would likely see the most benefit from tail-risk hedging.

But, he added, most institutional investors don't have such a high percentage of assets that would become illiquid in an extreme environment.

“If you have a significant percentage of assets that are liquid, then the cost of the insurance can be exorbitant,” Mr. Knutzen said.

Diversified Global Asset Management Corp., a Toronto-based institutional hedge fund and funds-of-funds manager, set up an account with PIMCO in April 2007 with the sole purpose of protecting the tail of its portfolio from capital market crises and other exogenous events, according to Warren Wright, managing director and CIO of alternative strategies. Mr. Wright declined to disclose the size of the portfolio.

"Explodes into value'

“In late 2006, early 2007, we approached Vineer (Bhansali) and began discussions to build a portfolio which would explode into value in a capital market crisis or when correlations are rising across markets,” Mr. Wright said in a phone interview.

At the time, DGAM was shopping around for insurance and settled on PIMCO because “it was a very large global long-only asset manager who could operate in all crises,” allowing DGAM to tactically adjust its hedge ratios regardless of market volatility, Mr. Wright said.

Fortunately for DGAM, it opened its account with PIMCO just before the financial collapse.

“We didn't know the crisis was going to hit, but portfolio insurance was extremely cheap at that moment,” Mr. Wright said.

As far as deciding whether to invest in tail-risk hedging, Mr. Wright said a lot depends on the cost of the insurance, the payoff of insurance under different scenarios, and the basis risk between the portfolio insurance and the portfolio itself — in other words, should catastrophic market events transpire, how will the insurance perform and will it offset losses on the long side of a portfolio?

Mr. Wright noted that given the implied volatility across markets, portfolio insurance today is expensive.

This year, DGAM has as much money in tail-risk hedging with PIMCO as it started with in 2007, having seen that investment quadruple in size at the height of the financial crisis and pocketing the profit, Mr. Wright said.

“We haven't exited completely but we've lowered our hedge ratios, buying less now than before because the systematic risk of a tail event is less today than at the beginning of the crisis,” he said. Mr. Wright also noted that the costs of hedging have risen and the basis risk is less clear.

That's part of the catch with tail-risk hedging. When investors want it, it's usually because an economic disaster is still fresh in their minds. But it is also when the strategy is most expensive.

“It's human nature to want to hedge right after the event and not think about insurance when the event hasn't happened in a long time,” Mr. Wright said. ?

Financial Credit Default Swap Prices Return to Earth

During the peak months of the financial crisis in late 2008 and early 2009, default risk as measured by the cost to insure the debt of US financial firms skyrocketed. For the firms that made it through the crisis and didn't actually go under, default risk has dropped dramatically, indicating that investors have become much more comfortable with Wall Street in recent months.

Below we highlight the change in credit default swap prices for the major US financial firms from the start of 2008 to their peaks, as well as the change from their peaks to now. As shown, Morgan Stanley CDS prices rose the most of firms that made it through, followed by Citigroup, Goldman, and Bank of America. Default risk rose the least for Wells Fargo and JP Morgan. Since the peak of the crisis, default risk has also fallen the most for Morgan Stanley at -90%. Goldman has seen its CDS prices fall 82% to under 100 bps, and JP Morgan ranks third in terms of default risk decline. JP Morgan currently has the lowest default risk of the firms highlighted.

Subscribe to Bespoke Premium to track default risk on a regular basis.

Cdsup

Cdsdown

NY Fed Model: No Chance of Recession in 2010, Economic Recovery Is Probably Already Underway

A few days ago, the New York Fed released its latest "Probability of U.S. Recession Predicted by Treasury Spread," with data through July 2009, and the Fed's recession probability forecast through July 2010 (see chart above, click to enlarge). The NY Fed's model uses the spread between 10-year and 3-month Treasury rates (3.38% spread in June, the second highest since May 2004) to calculate the probability of a recession in the United States twelve months ahead.

The Fed's data show that the recession probability peaked during the October 2007 to April 2008 period at around 35-40%, and has been declining since then in almost every month (see chart above and chart below). For July 2009, the recession probability is only 0.97% and by July 2010 the recession probability is only .09%, the second lowest level since May 2005.

Further, the Treasury spread has been above 2% for the last 17 months, a pattern consistent with the economic recoveries following the last six recessions (see chart above). The pattern of the recession probability index so far this year (going below double-digits and declining monthly) is very similar to the pattern starting in March 2002 that signalled the end of the 2001 recession (see chart below).

Friday, August 07, 2009

Corporate bonds (investment grade and high yield) are on a tear, up 12% and 40% respectively year to date. How do those figures compare to recent history? Very well.

Annual and cumulative returns of investment grade and high yield corporate bonds are shown below. On an annual basis, we can see that both are on or near record pace, but what I found amazing was how well they've tracked one another over that 20 year time frame cumulatively.


That got me thinking... what would happen if you were to allocate only to investment grade or high yield corporate bonds based upon which was cumulatively underperforming, at the end of each year, since 1989 (i.e. a mechanical method to swap from rich to cheap).

Lets call that the "EconomPic Method". Looking below, we see the EconomPic Method significantly outperformed, returning 600% vs 350% and 370% for investment grade and high yield over the past 20 years (that's more than 10% annualized growth). Compared to the total cumulative return of the S&P 500 during that time period (including dividends) we see outperformance of the EconomPic Method with significantly (understatement) less volatility.


Data mining? Of course! But interesting none-the-less.

Lunch is for wimps

Lunch is for wimps
It's not a question of enough, pal. It's a zero sum game, somebody wins, somebody loses. Money itself isn't lost or made, it's simply transferred from one perception to another.